
Crisis 2011 – Part I: The Other Shoe
• Peak Cheap Oil Cycle Two
• Stagflation, ho! The new NAIRU
• China credit bubble countdown
• Gold over $1300… and still no bubble
“The easiest period in a crisis situation is actually the battle itself. The most difficult is the period of indecision--whether to fight or run away. And the most dangerous period is the aftermath. It is then, with all his resources spent and his guard down that an individual must watch out for dulled reactions and faulty judgment.”
- Richard Milhous Nixon
Remember 1999, the good old days, when the darkest cloud on the horizon was Y2K? Before the tech bubble bust and recession, 911, the Iraq and Afghanistan wars and Katrina, when prophesies of post housing bubble economic catastrophe were abstract arguments between establishment economists and cranks, a curious form of doomertainment driving eyeballs to websites and cable “news” shows, and the global financial crisis and Great Recession were figments of pessimistic economists’ imaginations?
Since the first decade of the 2000 opened, it’s been one mess after another with hardly a year off between calamities.
Time for a fresh start. A new beginning. Enough of the wars and recessions. The somnambulist regulators. The crooked bankers. The short-sighted financial oligarchs.
We all deserve at least one blessed year of peace and quiet, of steady progress, growth, a booming stock market, without interruption by disasters man made and by the hand of Mother Nature, don’t we?
Yes we do, and we got one, in 2010.
2010 was the year deflation was banished, reflated economies grew, housing prices turned positive, albeit briefly, and commodity prices surged. The economy expanded all year, tamping out the dubious double dip scenario that discounted the power of the press – the printing press, that is.
The stock market bloomed, in fact did so for far longer, but no more, than I expected. A close over 11,500 on the DOW is a far cry from the 7,500 to 8,000 I forecast at the start of the year. Mea culpa.
Bond yields remained low, as I expected. Gold prices soared 25%, far above my 3% forecast. These reflation markets are tough to call.
The labor markets, while not improving dramatically, stopped getting worse.
Except for a hiccup or two in Europe, a few noisy students complaining about bailouts for bankers and austerity for everyone else, 2010 was a fine year. A breather. A respite. A year off in wine country away from the hurlyburly, addled headed riot of the big city.
The Other Shoe
2011 is back to the reality. Call it “the other shoe,” not a Manolo Blahnik but a Chinese knockoff Nike, stinky socks dangling out. The global financial crisis and recession left behind unpayable private and public debt and an unreformed political system. It will bite in 2011. Also the Greenspan Credit Bubble with Chinese Characteristics. Also the broken global monetary system. Also a finite global oil supply that strains under the demands imposed on it by politicians buying and selling it with a credit-based money supply constrained only by the collective skill of the Oligarch’s economists to invent new arguments to justify it more quickly than events demolish them.
The deconstructed fugly era starting in 2006 looks like this:
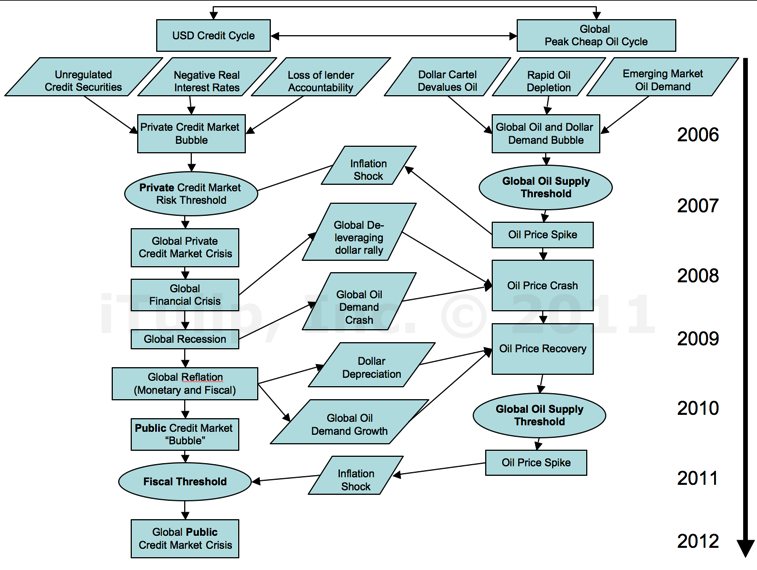
The decade we just survived since 2006
Flowcharts? Yes, flowcharts, starting with the past and cast into the future.
Why? The series of the events that are about to unfold are so complex and intertwined that it’s now necessary to break it all down into processes, into inputs and outputs, into decisions and decision criteria, just to get your heads around it, if one is to hope to distinguish the future course events from randomness.
To the ill-informed, the events of the past decade appeared to be random. Who could have known that a technology bubble can pop? That a housing bubble is a threat to the macro-economy? That a deflation spiral was impossible? The drivers of change for the next decade will be no less deterministic and non-random than they were during the asset bubble cycle that dominated the previous ten years. That we forecast here with sufficient accuracy to make a bundle of money.
You can’t tell the players without a program
This video lays out the three main processes that are driving change over the next ten years.
 
 
In addition to the complication of multiple drivers of change, the next decade will also be far more politically unpredictable than the last. Why? Because we blew it when we crashed the world economy in 2008. Uncool. The final straw. America’s trade partners want protection.
When the head of the World Bank starts talking about gold as part of a new global reserve currency, the era of the Treasury dollar standard is nearing an end. When the high priests say aloud what heretics like us said only in whispers in 2001, that the US is no longer the center of the universe, that the sun does not revolve around the earth, and that no quantity of creative math will make it so.
Nietzsche explained, “There is no truth, only power.” When power shifts, new power speaks a new truth, but don’t expect that truth to have much to do with yours or mine in daily life.
We all needed a solid year off from crisis, and 2010 was it. but sum the positive and negative inputs and the net directs the realist the conclusion that the next ten years will be even more crisis-ridden than the last, starting in 2011.
Crisis 2011
Housing prices are sinking again, even after billions in government subsidies were spent to prop it up. Fifteen months after the official end of the recession, the median duration of unemployment, a measure of how long the majority of the jobless have been out of work, remains at nearly twice the level it was at 15 months after the 1983 recession.
GDP growth under a 3% annual rate, while better than zero, is simply too slow to close the output gap created by the Housing Bust Recession before a new recession arrives to widen it yet again.
The US has suffered a credit cycle recession every ten years on average since WWII. The beginning of the Peak Cheap Oil Cycle around 2005 will make recessions more frequent, and I believe we’re due for another before the end of 2012.
We need more growth but no one seems to know how the economy can grow any faster, without a new bubble to boost growth the way the housing bubble and war spending rescued the economy in the early 2000s. With interest rates at zero the economy lacks a tail wind of falling interest rates as it had in the early 1980s.
A replay of the 1960s tax cut boom is out of the question, given the nation’s finances, as are more New Deal style programs, or an good export and housing boom like the one that pulled the economy out of a tailspin after WWII.
In fact, every trick that generated the 4% plus annual GDP growth that the US needs to reach output gap escape velocity is out of the question, save the unmentionable: an inflationary boom ala 1975 to 1980 that generated an average 5.6% annual real growth -- much to my surprise when I researched it -- while wiping out a generation’s debt.
Stagflation, ho! The new NAIRU
The most worrisome, but least unexpected, development is fast rising cost-push inflation. No surprise to iTulip readers, inflation that began as fast rising oil prices in late 2009 worked its way into commodity prices in early 2010 and started to make headlines as out-of-control food costs in China and India by the end of the year. As we’ll see, inflation in excess of 5% is already showing up in the official US producer price indexes.
In 2007 I guaranteed that a deflation spiral is impossible under the structure of our monetary system, that the Fed will put a floor on price deflation with a raft of orthodox and unorthodox policy measures, including bank bailouts and quantitative easing officially and dollar depreciation unofficially. The perverse result I expected was a combination of weak demand and rising costs, forcing producers to cut the quality and quantity of goods while maintaining prices. Several members started threads to rack the trend (See Inflation Snapshots).
That phase is ending. As the labor market in select industries improves, producers and wage earners regain pricing power. One class of society will be able to afford the higher prices and those left behind in dead or dying industries put under by the recession will continue to their now 30 year long ride down the living standards curve.
If interest rates rise, albeit more slowly than inflation, figure higher money costs into prices as well, and wage inflation, too, as competition for trained labor within growing industries, especially energy and technology related businesses, drives up wage rates.
Non-Accelerating Inflation Rate of Unemployment (NAIRU) is a monetarist concept that continues to guide Fed policy. My theory is that when the time comes, once the bogus deflation risk dust settled, after the rate cuts and QE and dollar depreciation – inflationary policy, by any other name – that persistently high energy prices will shift NAIRU such that inflation will rise off a 9% unemployment rate in 2011 as it did off 4.5% unemployment in 2007.
The costs of the Fed’s pro-inflation policies are largely born by the middle class. High food and gasoline prices, often dismissed by statisticians as too volatile to include in the CPI, are included in the producer price indexes, and the trend is clearly up.
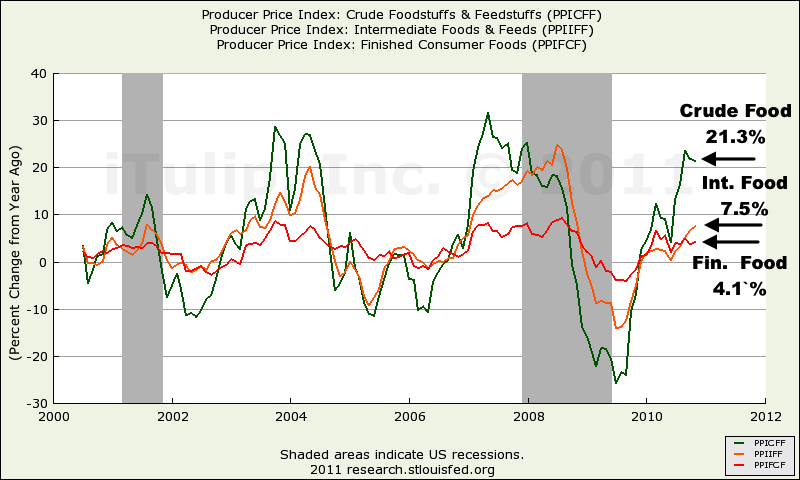
Crude, intermediate, and finished food price change rate: 21.2%, 7.5%, and 4.1% respectively.
Food may only represent 16% of personal consumption expenditures (PCE) for US consumers as a whole, but 4.1% food price inflation, with 7.5% intermediate food price inflation in the pipeline, is a big deal for a family making $50,000 a year. That’s down 4% from $52,000 ten years ago.
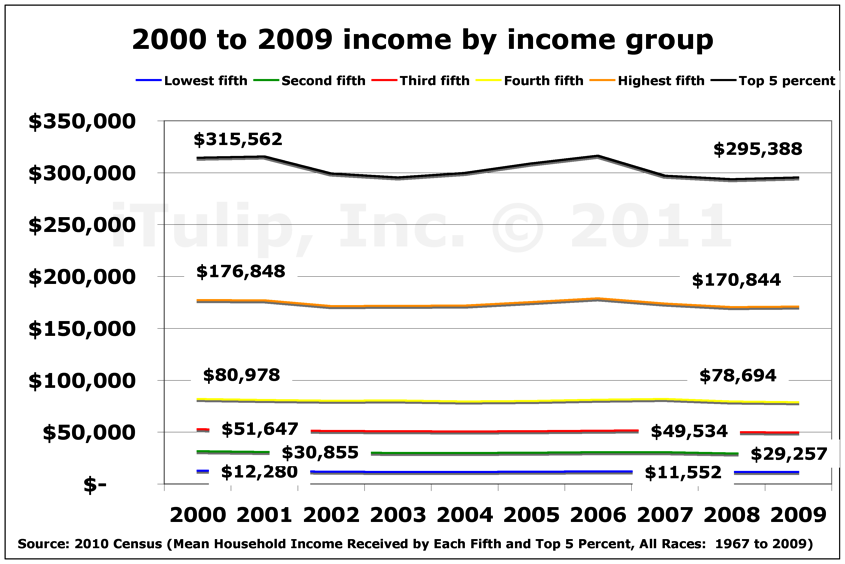
Mean income for five quintiles plus top 5%.
If it feels to you like you’re making less money now than 10 years ago, that’s because you probably are. Regardless of income group, the year 2000 was the high water mark for incomes in America. According to the 2010 US Census data, the income ride has been downhill ever since.
One of our members asked for an update of our now famous income inequality chart from 2006, the one that shows how income gains were distributed before and after the FIRE Economy era of the early 1980s, and we have not forgotten. The old chart used data up to 2005. Here’s the chart updated with the latest Census data.
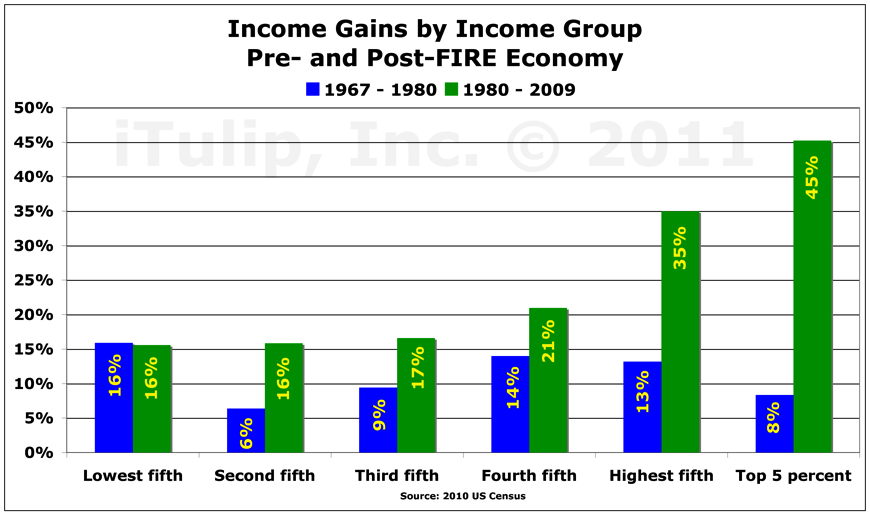
Distribution of income gains got even more skewed in the latter half of the last decade.
For those in the lower quintiles, as incomes decline and food and energy prices rise, food and energy as a portion of personal consumption expenditures will grow. Will they reach the 44% level they are at today in China? We may already be there for the bottom 20% income group, as the growing food stamps program rolls attest. High energy prices mean rising costs and falling incomes for the majority of Americans. This will be the major campaign issue in the next Presidential election.
This bears upon the Fed’s policy stance on cost-push inflation.
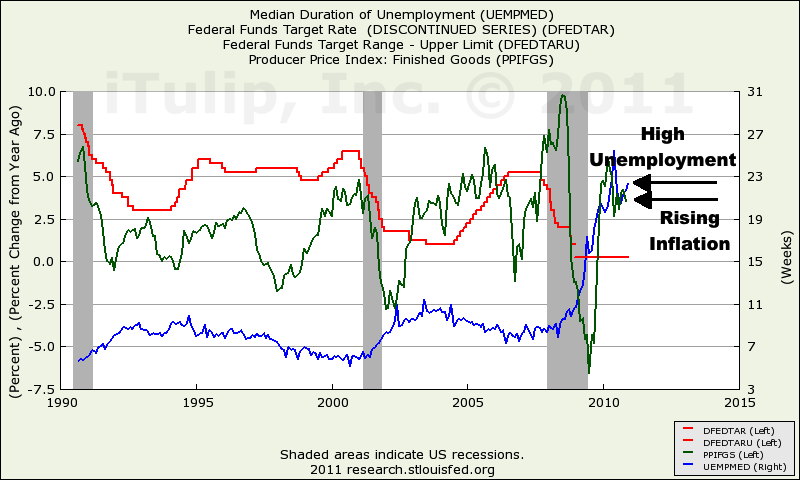
Unlike any previous recovery since the 1970s, inflation is near expansion peak levels
while unemployment remains higher than recession peak levels.
The Fed will be able to ignore inflation as long as it remains a wage earner’s and not a bondholder’s issue. As long as the bond market buys the weak demand-pull inflation story and bond yields do not rise too quickly, the Fed can turn the other cheek. Besides, the US can continue to export its inflation problem to China, Brazil, and elsewhere, and what are they going to do about it? They can’t fight capital inflow bonanza induced inflation produced by raising interest rates. That just makes the problem worse. So they poke away at the margins, imposing half-hearted capital controls, and complain. Or maybe 2011 is the year they do more?

Crisis 2011 – Part II: Conundrum Economics
The 2011 economic crisis hinges on oil and the dollar, on the contradictory need for the US to continue to manage post credit bubble debt deflation with dollar depreciation on the one hand and on the other the rising price of oil globally due to US weak dollar policy, rising global oil demand, and a fast-approaching oil supply threshold.
Will the Fed raise interest rates before the labor and housing markets regain their footing?
Global economic growth is again pushing oil demand up to the supply threshold it first reached in 2005 when the first Peak Cheap Oil Cycle drove prices over $100 two years later. In 2008, hedge funds and investment banks rode oil up to $147 before the financial crisis and global recession drove it back down briefly to under $40 in 2009.
The second Peak Cheap Oil Cycle started as soon as the recession ended in 2009. The Cycle will push oil back over $100 in 2011 and produce a price spike to perhaps $120 before one of two secondary crises occurs, the China Bubble Crash or the Fed raises rates or Congress reduces spending. For an economy in a balance sheet recession facing cost-push inflation from a weak currency and rising global demand for finite oil, the options aren’t pretty. (more... $ubscription)
iTulip Select: The Investment Thesis for the Next Cycle™
__________________________________________________
For a concise, readable summary of iTulip concepts read Eric Janszen's 2010 book The Postcatastrophe Economy: Rebuilding America and Avoiding the Next Bubble
 .
.To receive the iTulip Newsletter/Alerts, Join our FREE Email Mailing List
To join iTulip forum community FREE, click here for how to register.
Copyright © iTulip, Inc. 1998 - 2010 All Rights Reserved
All information provided "as is" for informational purposes only, not intended for trading purposes or advice. Nothing appearing on this website should be considered a recommendation to buy or to sell any security or related financial instrument. iTulip, Inc. is not liable for any informational errors, incompleteness, or delays, or for any actions taken in reliance on information contained herein. Full Disclaimer


Comment