Editor's Note: The following is a report by iTulip contributor Sean O'Toole of proprietary timely and accurate foreclosure data only available in graphical form on iTulip.com. Sean's company will launch the data service shortly, available to investors, hedge funds, and government agencies on a subscription basis.
 Q4 2006 Foreclosure Data Alert - January 12, 2007 (1PM EST)
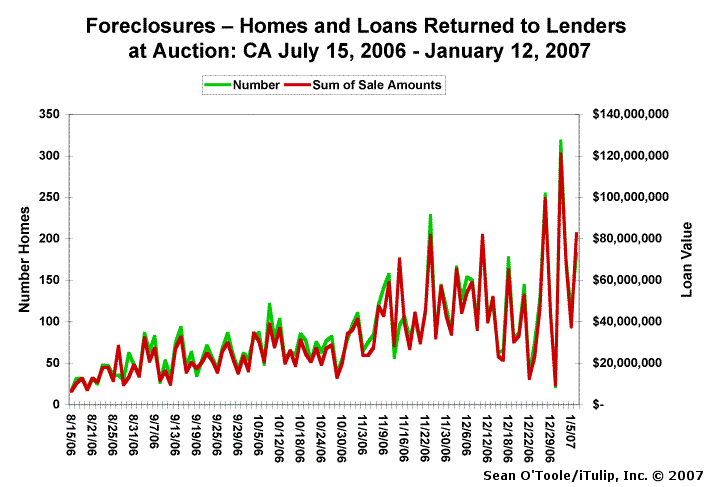
Number of Foreclosed Homes Returned to Lenders at Auction up more than a factor of 10 since July 2006
by Sean O'Toole
Coming 4th Quarter Foreclosure Activity Reports and their implications for housing, lending institutions, and the economy.
The last credible data that was widely published on foreclosure activity in the US was by DataQuick on October 18, 2006 for the 3rd quarter. Most of the reports you have read in the press since then about foreclosure and its implications for housing, sub-prime lenders, asset backed securities, and the economy in general were based on that report.
On one hand, the report was alarming. For Q3’06, CA foreclosures were up 111.8% from Q3’05 and 28.3% from the prior quarter. Despite this strong upward trend, most articles invariably followed up this data with a statement such as: Foreclosures are still at historically low levels, and the effect on today’s market is negligible.
When DataQuick says "historically low levels," they also disclose that they’ve only been tracking foreclosures since 1992, a key fact that many folks who use DataQuick's data don't know is very important. The reason that the start date of comparable foreclosure data for the last cycle is so important is that about two years after the last housing cycle bottom, foreclosures were already declining. If housing were indeed in the process of "bottoming out" now, as many forecast, then foreclosures should be starting to decline now. Instead, they are rising rapidly. Note the DataQuick data also show that foreclosures peaked in Q1’96, which correlates reasonable well with the bottom for the housing market. Foreclosures do not appear to be peaking, so it is unlikely that the housing market is near a bottom, yet.
As such it appears that DataQuick’s data spans a period of time that began during a period of increased foreclosure levels in the last cycle. As a result, we don’t have a clear picture of comparable foreclosure rates for the housing cycle period we are in currently compared to the last cycle, so no one can say whether current levels are "historically low" or not. Even if they are, that may well be a sign of a market peak rather than a bottom, implying further market volatility rather than market stability as usually inferred from the data.
In the coming weeks, as we see the Q4’06 foreclosure report released, it will be interesting to see how easily apparently alarming data can again be brushed aside as insignificant for the housing market, lending institutions, hedge funds and the economy. Unfortunately, due to a lack of sufficient historical data, and lags in current foreclosure data, I suspect this will the case.
Here for example is some data for California that you won't see soon anywhere but here on iTulip.


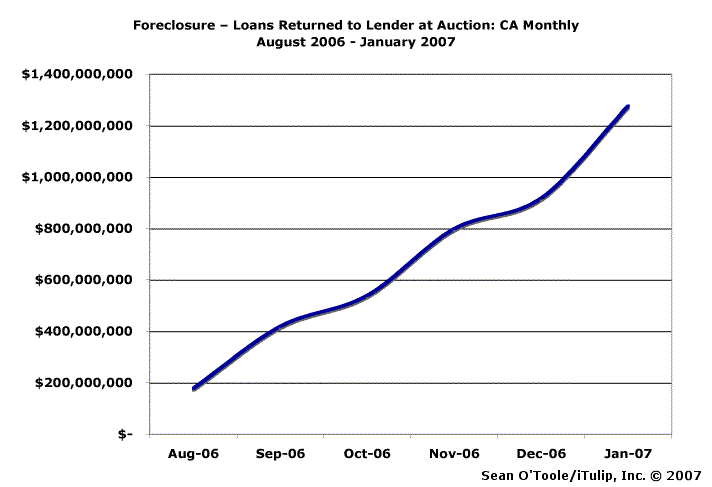
If we extrapolate the numbers from the first week of January for the month, we estimate $1.3 billion in loans will return to lenders in January. If the pattern of previous months followed, this number is likely conservative; the rate of increase has tended to rise week by week during previous months.
That’s right, lenders are on track to take back over a billion dollars worth of loans a month in January in California alone. A billion here, a billion there. That may soon add up to real money.
 Q4 2006 Foreclosure Data Alert - January 12, 2007 (1PM EST)
Number of Foreclosed Homes Returned to Lenders at Auction up more than a factor of 10 since July 2006
by Sean O'Toole
Coming 4th Quarter Foreclosure Activity Reports and their implications for housing, lending institutions, and the economy.
The last credible data that was widely published on foreclosure activity in the US was by DataQuick on October 18, 2006 for the 3rd quarter. Most of the reports you have read in the press since then about foreclosure and its implications for housing, sub-prime lenders, asset backed securities, and the economy in general were based on that report.
On one hand, the report was alarming. For Q3’06, CA foreclosures were up 111.8% from Q3’05 and 28.3% from the prior quarter. Despite this strong upward trend, most articles invariably followed up this data with a statement such as: Foreclosures are still at historically low levels, and the effect on today’s market is negligible.
When DataQuick says "historically low levels," they also disclose that they’ve only been tracking foreclosures since 1992, a key fact that many folks who use DataQuick's data don't know is very important. The reason that the start date of comparable foreclosure data for the last cycle is so important is that about two years after the last housing cycle bottom, foreclosures were already declining. If housing were indeed in the process of "bottoming out" now, as many forecast, then foreclosures should be starting to decline now. Instead, they are rising rapidly. Note the DataQuick data also show that foreclosures peaked in Q1’96, which correlates reasonable well with the bottom for the housing market. Foreclosures do not appear to be peaking, so it is unlikely that the housing market is near a bottom, yet.
As such it appears that DataQuick’s data spans a period of time that began during a period of increased foreclosure levels in the last cycle. As a result, we don’t have a clear picture of comparable foreclosure rates for the housing cycle period we are in currently compared to the last cycle, so no one can say whether current levels are "historically low" or not. Even if they are, that may well be a sign of a market peak rather than a bottom, implying further market volatility rather than market stability as usually inferred from the data.
In the coming weeks, as we see the Q4’06 foreclosure report released, it will be interesting to see how easily apparently alarming data can again be brushed aside as insignificant for the housing market, lending institutions, hedge funds and the economy. Unfortunately, due to a lack of sufficient historical data, and lags in current foreclosure data, I suspect this will the case.
Here for example is some data for California that you won't see soon anywhere but here on iTulip.

The number of foreclosures that lenders are taking back in California has increased from an average of 32 a day in August 2006, to 300 a day in December 2006. In dollars that’s an increase from $13.3M per day to $45.9M in four months. So far, for the first week of 2007, the numbers are 161 homes and $63.8M–per day.

If we extrapolate the numbers from the first week of January for the month, we estimate $1.3 billion in loans will return to lenders in January. If the pattern of previous months followed, this number is likely conservative; the rate of increase has tended to rise week by week during previous months.
That’s right, lenders are on track to take back over a billion dollars worth of loans a month in January in California alone. A billion here, a billion there. That may soon add up to real money.
You heard it here first.
__________________________________________________
Special iTulip discounted subscription and pay services flogged here:
For a book that explains iTulip concepts in simple terms, see americasbubbleeconomy
For a macro-economic and geopolitical View from Europe see Europe LEAP/2020
For macro-economic and geopolitical currency ETF advisory services see Crooks on Currencies
For the safest, lowest cost way to buy and trade gold, see The Bullionvault
To receive the iTulip Newsletter or iTulip Alerts, Join our FREE Email Mailing List
Copyright © iTulip, Inc. 1998 - 2007 All Rights Reserved
All information provided "as is" for informational purposes only, not intended for trading purposes or advice. Nothing appearing on this website should be considered a recommendation to buy or to sell any security or related financial instrument. iTulip, Inc. is not liable for any informational errors, incompleteness, or delays, or for any actions taken in reliance on information contained herein. Full Disclaimer

Comment