Announcement

Collapse
No announcement yet.

Case-Shiller Housing Charts - Long-term, etc.

Collapse
X
 
  • Filter
  • Time
  • Show
Clear All
new posts

  • #46
    Re: Case-Shiller Housing Charts - Long-term, etc.

    Originally posted by bart View Post
    Total unemployment is already around 23% and sure could go higher - and that still means over 3/4 are working while the CS housing index is "only" down 4% annually, total money supply is still growing, hourly earnings are still growing nominally, the Fed is on the job with relative interest rate control, sentiment is quite negative on housing, see step 8 & 9 above, I'm allowing for another 5-10% drop, etc.

    Rampant sure may happen, but we have 8%+ right now - way higher than what we had in the last hard asset cycle from 1966-1980... and nominal national house prices basically never went down during that period.
    Thank you Bart - appreciate your thoughts.

    Comment


    • #47
      Re: Case-Shiller Housing Charts - Long-term, etc.

      Originally posted by bart View Post
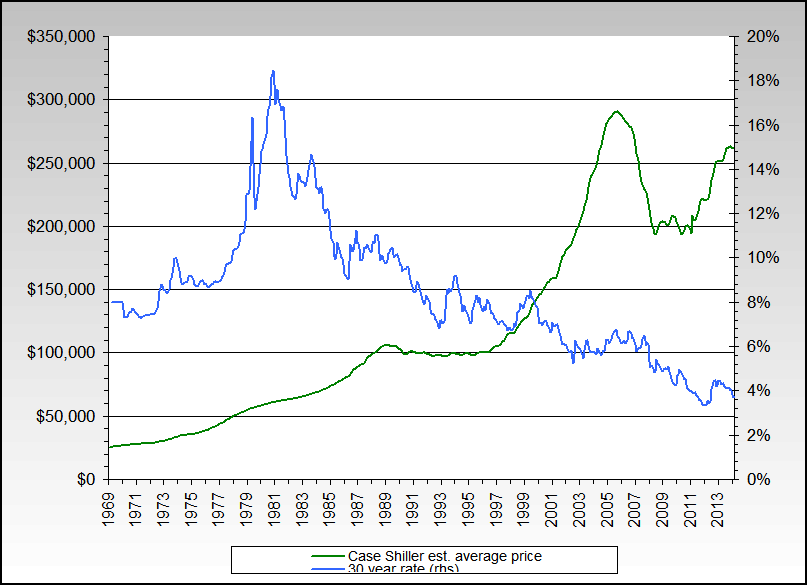
      For what its worth on rates:

      So, there is no correlation between interest rates and home prices ? From 1976 to 1986, interest rate went from ~8% to 18% to 8%, but the home prices continued to rise.

      Comment


      • #48
        Re: Case-Shiller Housing Charts - Long-term, etc.

        Originally posted by photoncounter View Post
        So, there is no correlation between interest rates and home prices ? From 1976 to 1986, interest rate went from ~8% to 18% to 8%, but the home prices continued to rise.
        Ideally, there would be a CPI line in there too - it was also going up fast.
        http://www.NowAndTheFuture.com

        Comment


        • #49
          Re: Case-Shiller Housing Charts - Long-term, etc.

          Originally posted by aaron View Post
          Aren't prices always higher in the summer than the spring?
          Generally, but the effect is not usually all that pronounced, especially after backing out the usual increase in home prices from one year to the next. (Of course in recent years that overall change has usually been negative.) The volume of homes sold, however, definitely increases in the summer.

          Originally posted by aaron View Post
          It seems to me people with bigger, more expensive houses will wait until summer to sell. They have kids. People with smaller, cheaper houses probably have less children on average and do not care about the school year. They can sell their house at any time.
          Yes, but in most places, summer usually provides the best house-hunting and moving weather, and that tends to draw more people into the market, whether they have kids or not. In closed sales counts (the house has actually sold and passed ownership), what is usually more pronounced than summer vs. spring is January vs. the rest of the year; few people are out buying houses between Thanksgiving and New Years. Plus a lot of houses get pulled off the market in late December and wait until early spring to relist, giving the house a new listing number and showing up as a new entry in the brokers' lists. (I think some MLA's have started to crack down on that a little.)

          Originally posted by aaron View Post
          I'd like see a price per square foot graph or something to reduce the noise.
          Not sure how enlightening that really turns out to be. Everyone knows that houses are bigger now than they used to be, but the nominal price per square foot of new homes has continued to climb as well.


          Adjusting for inflation provides a different picture, however. Since the 1960's, new home prices per square foot have oscillated in a flat range. The cheapest time to buy a house by this measure was immediately following the end of WW II.


          Originally posted by aaron View Post
          I am itching to buy a house, but in my opinion they are still way over-priced. I may end up taking out one of those free money mortgages next spring and making the plunge regardless. Hopefully, the next recession is in full force then and people will sell cheap.
          I don't really follow the Seattle market, but, using Shiller's conclusion that houses track inflation over the long term and should return to that relationship, I believe Portland is still overvalued by 15-20%. Using rent/own calculations, I believe it is about 10% above the late 1980's low. Using a price/income ratio, it is about 75% above the late 1980's low (lol?), but is quite near the average.

          Comment


          • #50
            Re: Case-Shiller Housing Charts - Long-term, etc.

            If rates start to move up, everyone on the fence will buy.

            Comment


            • #51
              Re: Case-Shiller Housing Charts - Long-term, etc.

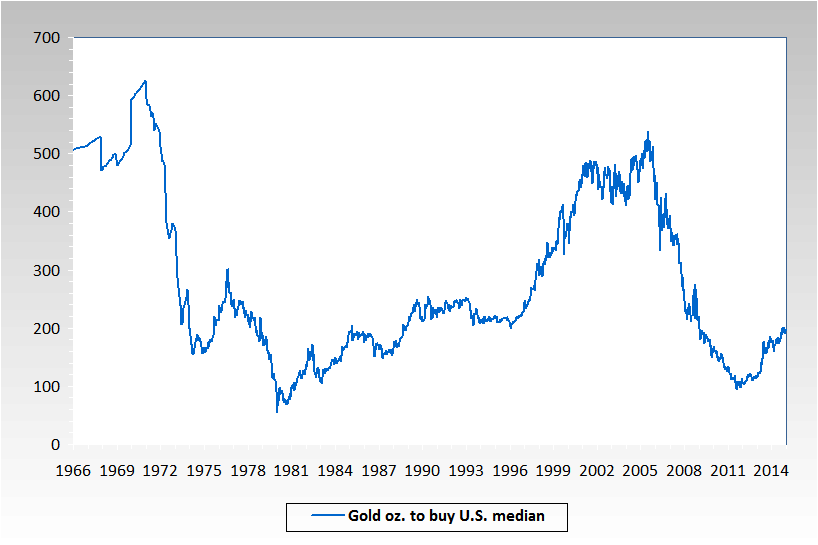
              Does anyone have a good chart showing the ratio of the median home price to the price of gold?

              Any thoughts about what it means for us to be at a relatively low point in that cycle? Is there a point at which you would trade gold for RE?

              Comment


              • #52
                Re: Case-Shiller Housing Charts - Long-term, etc.

                http://www.NowAndTheFuture.com

                Comment


                • #53
                  Re: Case-Shiller Housing Charts - Long-term, etc.

                  Thanks, bart.

                  Even though the trend is still down, I have to say that the 100 oz per house point looks like an awfully tempting point to start thinking about making a switch.

                  Are current median homes larger than they were at the last minimum in 1979? Does the data look much different based on price per square foot vs. gold, rather than total price?

                  Comment


                  • #54
                    Re: Case-Shiller Housing Charts - Long-term, etc.

                    thanks for those graphs, zoog. They are interesting.

                    If rates start to move up, everyone on the fence will buy.
                    Do you think there are a lot of people on the fence? Are they waiting for cheaper rates?

                    I suspect there will be fence sitters who buy. Are their numbers large enough to make a dent?

                    Comment


                    • #55
                      Re: Case-Shiller Housing Charts - Long-term, etc.

                      Originally posted by Sharky View Post
                      Thanks, bart.

                      Even though the trend is still down, I have to say that the 100 oz per house point looks like an awfully tempting point to start thinking about making a switch.

                      Are current median homes larger than they were at the last minimum in 1979? Does the data look much different based on price per square foot vs. gold, rather than total price?
                      Yes, median house size is bigger now but the amount of land is smaller too.

                      Unfortunately, I don't track any of the square footage indexes so can't positively comment in the area. I also don't know if they take amount of land into account.
                      http://www.NowAndTheFuture.com

                      Comment


                      • #56
                        Re: Case-Shiller Housing Charts - Long-term, etc.

                        Originally posted by Sharky View Post
                        ...Are current median homes larger than they were at the last minimum in 1979? Does the data look much different based on price per square foot vs. gold, rather than total price?
                        Originally posted by bart View Post
                        Yes, median house size is bigger now but the amount of land is smaller too.

                        Unfortunately, I don't track any of the square footage indexes so can't positively comment in the area. I also don't know if they take amount of land into account.
                        census.gov has a series for median lot size, although it only goes back to 1976 so does not give us a long historical view. From the data available, it seems to the lot size has fluctuated up and down, rather than a steady decline in size as we might expect from observing "postage stamp" lots in some newer developments.


                        Adjusting for inflation, using 2010 dollars (consistent with charts I posted earlier in this thread showing price per square foot of the house itself), the price per lot square feet has risen and fallen with the overall price of the new home.


                        Of course a national median lot size smooths out extremes at both ends. Lot sizes in different parts of the country, as well as urban vs suburban vs exurban areas vary considerably. The national median lot size in 2008 (last reported year in the series) is 8,854 square feet. The standard residential lot size in my city, Portland, has been 5,000 square feet since the 1866 platting, well below the median. Yet in many parts of the country, particularly in suburbs, lot sizes are closer to the median, or even larger.

                        Originally posted by zoog View Post
                        ...Everyone knows that houses are bigger now than they used to be, but the nominal price per square foot of new homes has continued to climb as well.


                        Adjusting for inflation provides a different picture, however. Since the 1960's, new home prices per square foot have oscillated in a flat range. The cheapest time to buy a house by this measure was immediately following the end of WW II.

                        Last edited by zoog; September 04, 2011, 03:09 PM.

                        Comment


                        • #57
                          Re: Case-Shiller Housing Charts - Long-term, etc.

                          Originally posted by aaron View Post
                          thanks for those graphs, zoog. They are interesting.

                          Do you think there are a lot of people on the fence? Are they waiting for cheaper rates?

                          I suspect there will be fence sitters who buy. Are their numbers large enough to make a dent?
                          There are always fence sitters. Some sit for years and years. The number one thing that gets them off the fence is a jump in rates.

                          Comment


                          • #58
                            Re: Case-Shiller Housing Charts - Long-term, etc.

                            Lots more housing bubble charts available here..... http://www.australianpropertyportal.com/Gallery
                            The Great Australia Real Estate Bubble

                            Comment


                            • #59
                              Re: Case-Shiller Housing Charts - Long-term, etc.

                              Another small quarterly increase for Q3 2011, bringing the nominal index to 31.35% below peak, and CPI-adjusted to 39.51% below peak.


                              Atlanta, Las Vegas, and Phoenix have set new lows. Vegas and Phoenix were minor bumps down, but Atlanta lost nearly 5% from August to September. It could be an error, will have to wait to see if they revise the data.


                              Breaking into price tiers, Atlanta and Las Vegas show new lows in all three categories, but Phoenix is hovering just above maximum lows.


                              Comment


                              • #60
                                Re: Case-Shiller Housing Charts - Long-term, etc.

                                The nominal index basically went nowhere for 2011. After dropping from 31.05% below peak in Q4 2010 to 33.81% below in Q1 2011, it recovered somewhat through the middle of the year, then ended up with a new low (barely) at 33.83% below peak in Q4.


                                The CPI-adjusted index has set a new low at 41.39% below peak, beating the previous low in Q1 of 40.79%.


                                Atlanta, Las Vegas, Seattle, Tampa, and the 10-city and 20-city composites are all at new lows, with Chicago and Portland both squeaking by.


                                In the price tiers data, Atlanta is at new lows for all three categories, Las Vegas is at new lows for low-end and high-end homes, Los Angeles is at a new low for high-end, Miami for low-end, Portland for low and mid, Seattle for low and mid, and Tampa for low and mid.

                                Comment

                                Working...
                                X