Re: Chart: Low, Mid & High Housing Bubble Indices
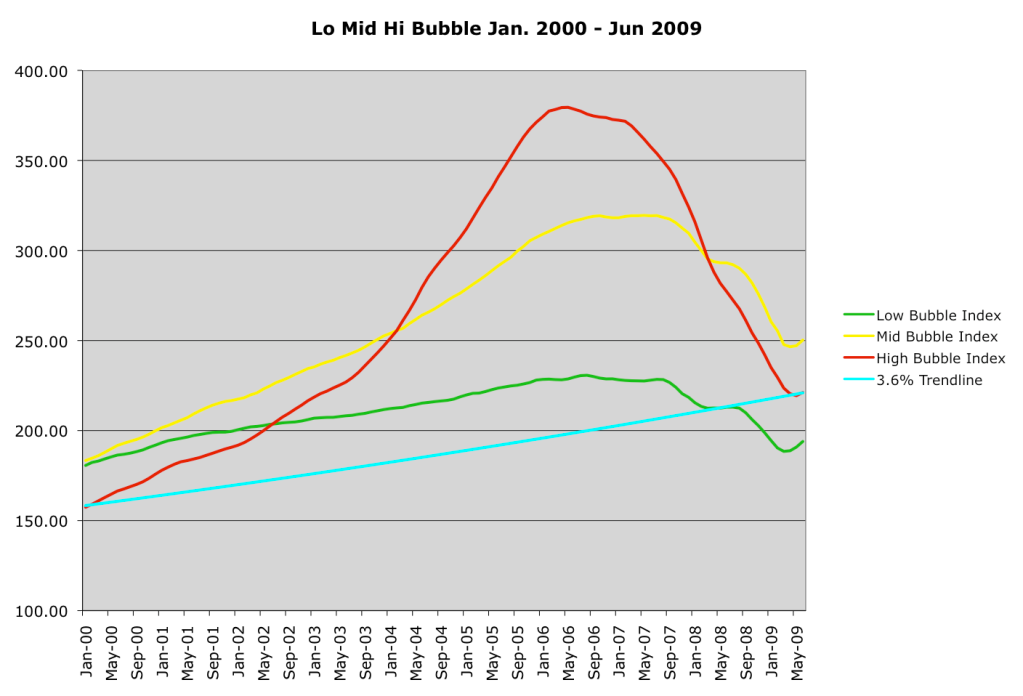
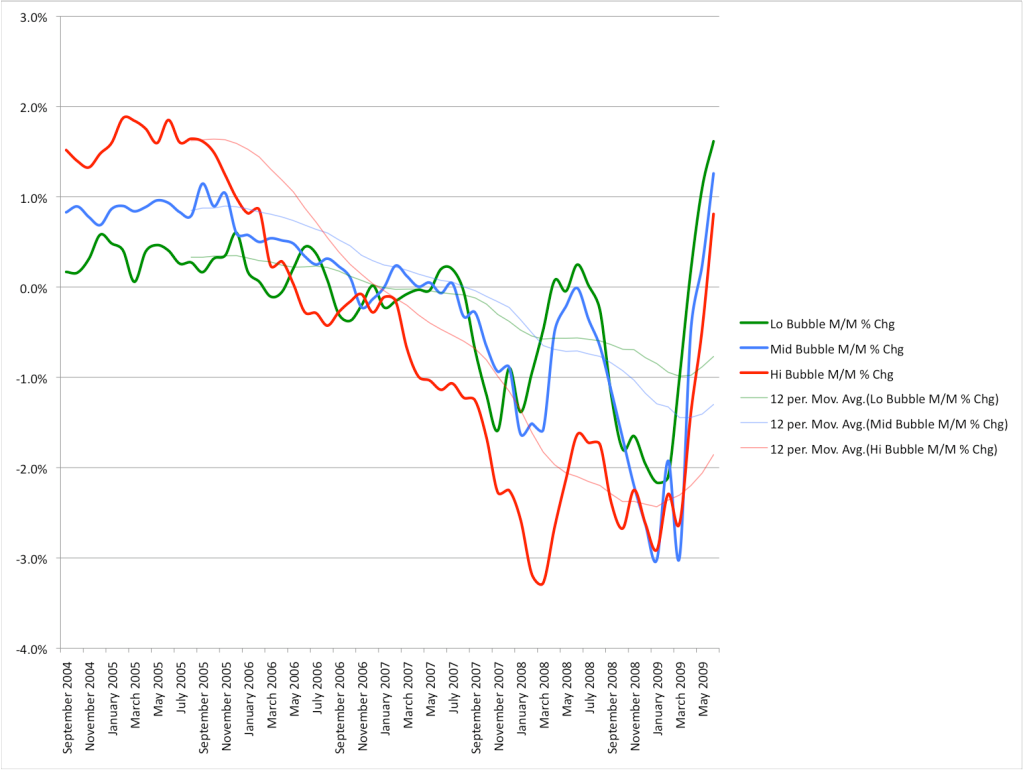
This just in: Lo, Mid & Hi bubble down 2.3%, 3.1% and 3.0%, respectively. Worst month on record for Lo and Mid, third worst for Hi.
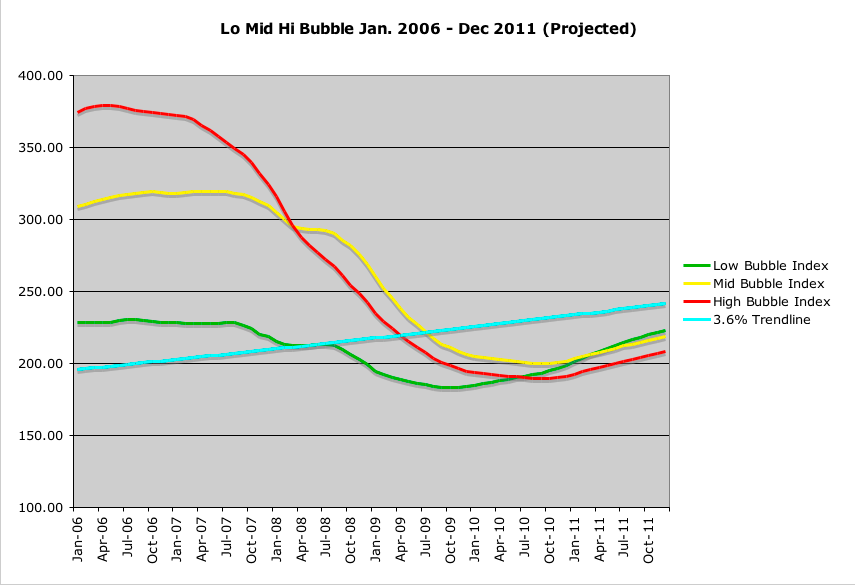
Here's the latest chart, along with what some might call optimistic projections for the next 3 years, based on continuing poor macroeconomic conditions gradually improving, along with the trendline's pull to revert to the mean.
Jimmy


Comment