Announcement

Collapse
No announcement yet.

Chart: Low, Mid & High Housing Bubble Indices

Collapse
X
 
  • Filter
  • Time
  • Show
Clear All
new posts

  • #16
    Re: Chart: Low, Mid & High Housing Bubble Indices

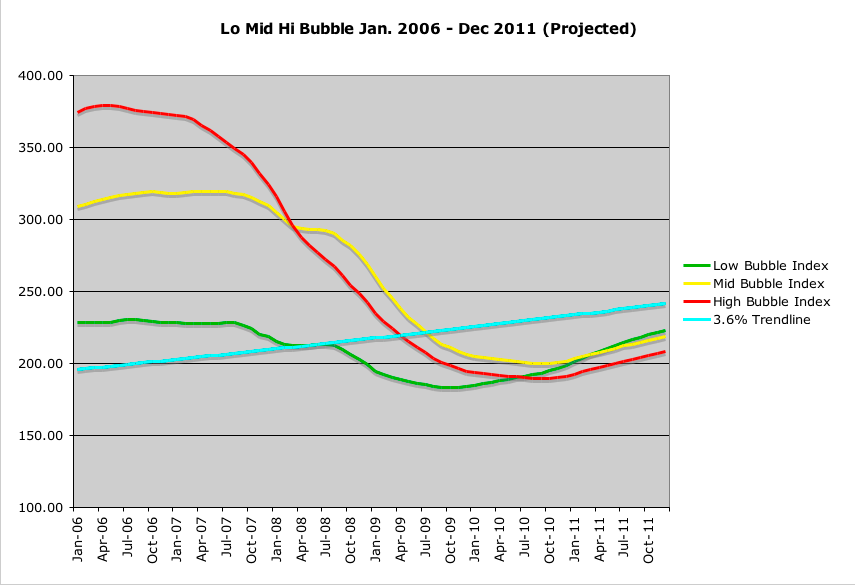
    This just in: Lo, Mid & Hi bubble down 2.3%, 3.1% and 3.0%, respectively. Worst month on record for Lo and Mid, third worst for Hi.

    Here's the latest chart, along with what some might call optimistic projections for the next 3 years, based on continuing poor macroeconomic conditions gradually improving, along with the trendline's pull to revert to the mean.

    Jimmy
    Comment


    • #17
      Re: Chart: Low, Mid & High Housing Bubble Indices

      Nice Jimmy! Thank you.

      I was just playing with the C-S data myself - they have a series that breaks each market into low/mid/high $$ as well. Very helpful stuff.

      FWIW... I was also guesstimating the nominal bottom towards the end of 2010 (though I don't think it's likely you'd get caught out by a substantial rise if you waited another year).

      The big question for me at this point is how long TPTB try to/are able to keep interest rates so low - and what happens when that falls apart.

      12% interest rates imply a sales price of 50% compared to that when rates are 4.5% (holding payments steady) and cash could go a long way then...

      Comment


      • #18
        Re: Chart: Low, Mid & High Housing Bubble Indices

        I have a bit of a question about C-S. Everything I've seen describes the indexes as 20 cities or 10 cities, and I'm just wondering how far out into the burbs do they actually go? It seems most of the damage has been done in the far outer regions and I don't know if C-S is actually catching these areas. If they're not, the figures are probably understating.

        Comment


        • #19
          Re: Chart: Low, Mid & High Housing Bubble Indices

          Originally posted by we_are_toast View Post
          I have a bit of a question about C-S. Everything I've seen describes the indexes as 20 cities or 10 cities, and I'm just wondering how far out into the burbs do they actually go? It seems most of the damage has been done in the far outer regions and I don't know if C-S is actually catching these areas. If they're not, the figures are probably understating.
          This should help answer your question:

          S&P/Case-Shiller Home Price Indices Methodology (PDF)

          Starting on page 8. For example for New York City the represented counties are: Fairfield CT, New Haven CT, Bergen NJ, Essex NJ, Hudson NJ, Hunterdon NJ, Mercer NJ, Middlesex NJ, Monmouth NJ, Morris NJ, Ocean NJ, Passaic NJ, Somerset NJ, Sussex NJ, Union NJ, Warren NJ, Bronx NY, Dutchess NY, Kings NY, Nassau NY, New York NY, Orange NY, Putnam NY, Queens NY, Richmond NY, Rockland NY, Suffolk NY, Westchester NY, Pike PA.

          Originally posted by WDCRob View Post
          Nice Jimmy! Thank you.

          I was just playing with the C-S data myself - they have a series that breaks each market into low/mid/high $$ as well. Very helpful stuff.
          ...
          I have some charts of the low/mid/high within markets (towards the bottom of that post). I have not updated them with the latest numbers but should give you a basic idea.

          Comment


          • #20
            Re: Chart: Low, Mid & High Housing Bubble Indices

            Originally posted by WDCRob View Post
            Nice Jimmy! Thank you.

            I was just playing with the C-S data myself - they have a series that breaks each market into low/mid/high $$ as well. Very helpful stuff.
            Before I start on today's update, the first in 5 months, I want to reiterate what my 3 tranches are: Low Bubble Cities (less than 6% annual housing price growth during 2000-2006 bubble period), Mid Bubble Cities (6-10% annual growth during bubble period), and High Bubble Cities (over 10% average annual growth during bubble). This is different than the Case-Shiller breakdown by 'low, mid and high' housing price. You may want to read the first post in the thread for more details.

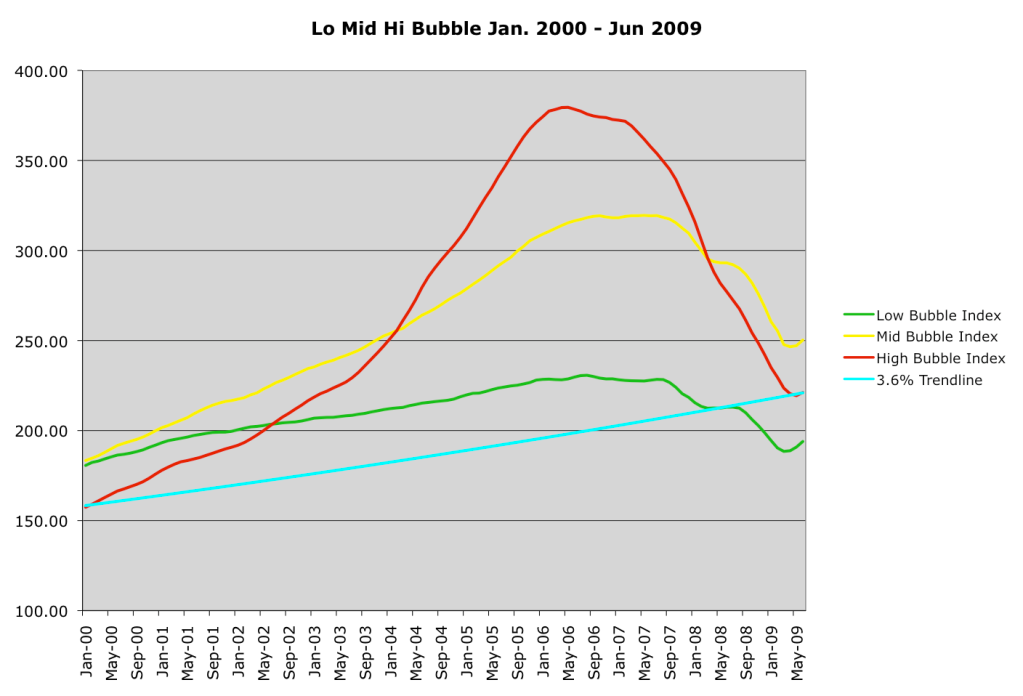
            Here's the most recent chart with the June data, noteworthy because it shows the first positive move in all 3 indices since the bubble burst. Lo is up 2.9% in 3 months, Mid is up 1.5% in 2 months, and even free-falling Hi Bubble managed to post its first positive month in 3 years, right as it hit the long-term trendline.


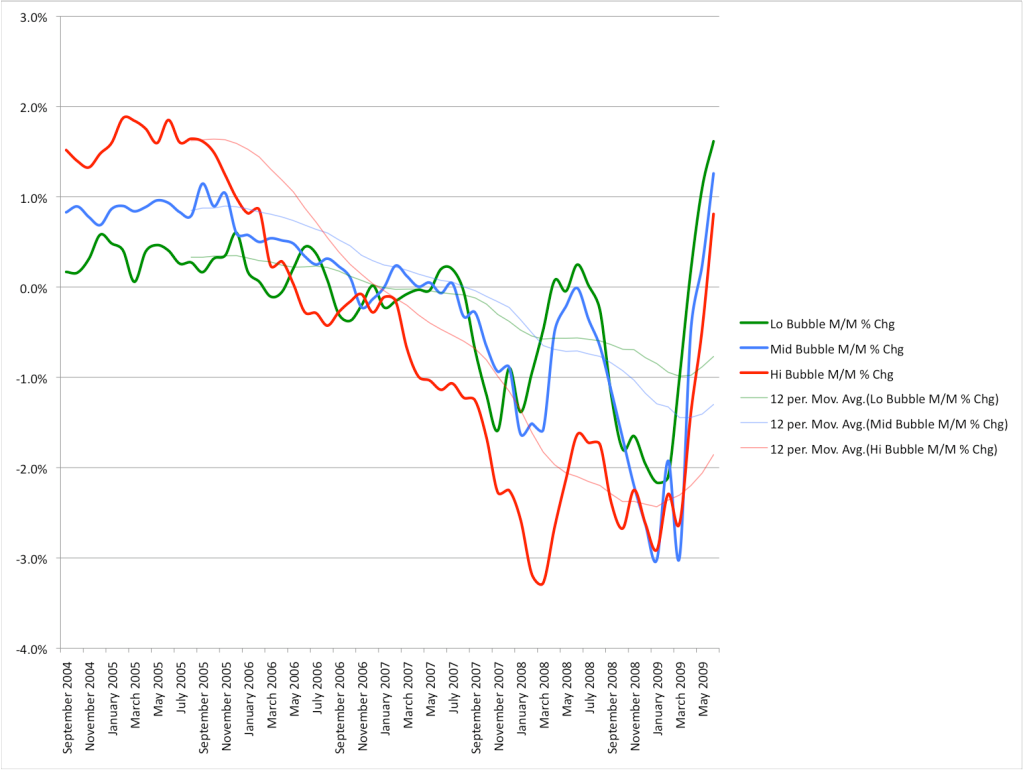
            Here's another interesting view of the data, showing the dramatic reversal in the first derivative (rate of change) in each index. Note that while there have been some mildly positive month-over-month changes in the indices, none have exceeded +0.2%. Our most recent month boasts Lo, Mid and Hi gains of 1.6%, 1.3% and .8%, respectively. Looking past the volatility, all of the 12mo moving averages are in uptrends.


            What does this mean? My take is that rates are low and overall prices have come back to Earth, so bargain hunters have started wading into the the market. I would be surprised if Hi Bubble's negative momentum doesn't return and overshoot the mean on the low side. Mid Bubble still seems poised to make a soft landing on the trendline, but will probably overshoot some as well. Lo Bubble, having been overshooting for a year, is 13.5% below trend, and has lots of positive potential on its way back to the mean. It would take sustained 5% price growth for Lo Bubble to get back to the mean by 2020.

            -Jimmy

            Comment


            • #21
              Re: Chart: Low, Mid & High Housing Bubble Indices

              Originally posted by jimmygu3 View Post
              Before I start on today's update, the first in 5 months, I want to reiterate what my 3 tranches are: Low Bubble Cities (less than 6% annual housing price growth during 2000-2006 bubble period), Mid Bubble Cities (6-10% annual growth during bubble period), and High Bubble Cities (over 10% average annual growth during bubble). This is different than the Case-Shiller breakdown by 'low, mid and high' housing price. You may want to read the first post in the thread for more details.

              Here's the most recent chart with the June data, noteworthy because it shows the first positive move in all 3 indices since the bubble burst. Lo is up 2.9% in 3 months, Mid is up 1.5% in 2 months, and even free-falling Hi Bubble managed to post its first positive month in 3 years, right as it hit the long-term trendline.


              Here's another interesting view of the data, showing the dramatic reversal in the first derivative (rate of change) in each index. Note that while there have been some mildly positive month-over-month changes in the indices, none have exceeded +0.2%. Our most recent month boasts Lo, Mid and Hi gains of 1.6%, 1.3% and .8%, respectively. Looking past the volatility, all of the 12mo moving averages are in uptrends.


              What does this mean? My take is that rates are low and overall prices have come back to Earth, so bargain hunters have started wading into the the market. I would be surprised if Hi Bubble's negative momentum doesn't return and overshoot the mean on the low side. Mid Bubble still seems poised to make a soft landing on the trendline, but will probably overshoot some as well. Lo Bubble, having been overshooting for a year, is 13.5% below trend, and has lots of positive potential on its way back to the mean. It would take sustained 5% price growth for Lo Bubble to get back to the mean by 2020.

              -Jimmy
              thx for updating this. my guess... a bounce from gov't throwing everything & the kitchen sink at housing. not sustainable without rising employment & incomes.

              Comment


              • #22
                Re: Chart: Low, Mid & High Housing Bubble Indices

                Originally posted by metalman View Post
                thx for updating this. my guess... a bounce from gov't throwing everything & the kitchen sink at housing. not sustainable without rising employment & incomes.
                Are you implying that the government throwing money at a market beyond growth in overall inflation or growth in population, consumption and productive economy creates a bubble?

                Whatever happens in the short term won't matter compared to the forces of generational dynamics. The boomer die off will shift the real value of homes. Just think of a couple in their mid 70s who can't afford the second home or grandma moving in with her broken hip. What is the half life of that cultural moment? 2025. 2030. What will most of those Chinese dry wall track houses built in areas without industry or water be worth by then? Who is going to pay the condo fees in Vegas?
                If you want to fix housing, then allow a wave of large family immigrants to come as and pay a good wage as bed pan changers or building solar powered
                wheelchairs.

                Gen x didn't have huge families and I don't think the texting millenials will get away from facebook long enough to make big families to fill houses.

                Builders can be kept busy making new green mixed use housing after we bullldoze the abandoned fringes of exurbia.


                Right now inflation will wash away all sins.

                Comment


                • #23
                  Re: Chart: Low, Mid & High Housing Bubble Indices

                  Originally posted by metalman View Post
                  thx for updating this. my guess... a bounce from gov't throwing everything & the kitchen sink at housing. not sustainable without rising employment & incomes.
                  Let's hope not. I don't have a HOUSE!?!?!:eek:

                  Comment


                  • #24
                    Re: Chart: Low, Mid & High Housing Bubble Indices

                    Originally posted by goadam1 View Post
                    Are you implying that the government throwing money at a market beyond growth in overall inflation or growth in population, consumption and productive economy creates a bubble?

                    Whatever happens in the short term won't matter compared to the forces of generational dynamics. The boomer die off will shift the real value of homes. Just think of a couple in their mid 70s who can't afford the second home or grandma moving in with her broken hip. What is the half life of that cultural moment? 2025. 2030. What will most of those Chinese dry wall track houses built in areas without industry or water be worth by then? Who is going to pay the condo fees in Vegas?
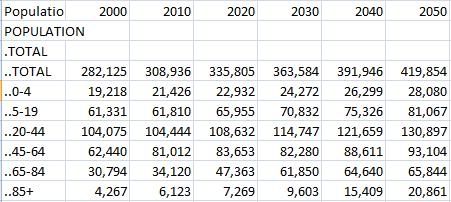
                    US Census estimates indicate that the overall population will continue to grow over the next 40 years, but growth in the 45-65 range will stagnate for the next 20 years due to the aging boomers.


                    I personally think the boomers retiring will put downward pressure on stocks as they shift from being net investors to net sellers. But housing-wise, I see it as more of a problem for new construction than existing homes. We are still going to need all the houses we have and then some, but we won't need a building frenzy like we had earlier this decade.

                    You're right about some of the ex-urbs. They'll have to be heavily discounted and many will probably be abandoned or bulldozed.

                    -Jimmy

                    Comment


                    • #25
                      Re: Chart: Low, Mid & High Housing Bubble Indices- Rent or Buy

                      There seems to be a huge number of Rent or Buy homes on the Market - at least in my area.

                      Has this phenomena of offering a home for Rent or to Purchase ever happened before??? Seems to me its just a sign that there is no firm bottom in the Real Estate market - yet.

                      I'll confess to having a bias towards seeing more downside - of course I could be wrong.

                      Are other areas experiencing the FOR RENT or FOR SALE phenomena?

                      Comment


                      • #26
                        Re: Chart: Low, Mid & High Housing Bubble Indices- Rent or Buy

                        Originally posted by BK View Post
                        There seems to be a huge number of Rent or Buy homes on the Market - at least in my area.

                        Has this phenomena of offering a home for Rent or to Purchase ever happened before??? Seems to me its just a sign that there is no firm bottom in the Real Estate market - yet.

                        I'll confess to having a bias towards seeing more downside - of course I could be wrong.

                        Are other areas experiencing the FOR RENT or FOR SALE phenomena?
                        I have had my house on the market here in Atlanta for 6 months. I get calls from people asking if I will rent it out. I think from their side it's a function of not having a 20% down payment and the unavailability of jumbo mortgages. From the sellers' side, I think it's people who have to get out of the house and are happy to get cash flow from it to cover the mortgage (or at least come close).

                        In our case we don't have to move, so we're probably taking it off the market when the listing expires next week.

                        Jimmy

                        Comment


                        • #27
                          Re: Chart: Low, Mid & High Housing Bubble Indices

                          Originally posted by metalman View Post
                          thx for updating this. my guess... a bounce from gov't throwing everything & the kitchen sink at housing. not sustainable without rising employment & incomes.
                          You're probably right about unsustainability, but I don't think we've seen the gov't's kitchen sink yet. Most of the programs have involved lowering a select few's monthly payments so they can stay in the house and avoid foreclosure. Far more have not met the absurd requirements for these mortgage restructuring programs and have been foreclosed upon. Either way, the home values are not supported by the cram-down programs.

                          Of course, the government is now essentially the only player in the mortgage lending business. Mortgages that don't conform to their guidelines (e.g. jumbos), either no longer exist or charge hefty premiums. So the mortgage market, and therefore the housing market, is largely in the hands of Freddie & Fannie. If it weren't for them, the housing market would have completely collapsed. They can always decide to keep mortgage rates artificially low, even if we see rising bond yields.

                          Jimmy
                          Last edited by jimmygu3; September 01, 2009, 11:26 AM.

                          Comment


                          • #28
                            Re: Chart: Low, Mid & High Housing Bubble Indices

                            Originally posted by jimmygu3 View Post
                            You're probably right about unsustainability, but I don't think we've seen the gov't's kitchen sink yet. Most of the programs have involved lowering a select few's monthly payments so they can stay in the house and avoid foreclosure. Far more have not met the absurd requirements for these mortgage restructuring programs and have been foreclosed upon. Either way, the home values are not supported by the cram-down programs.
                            Each program to date has been a complete failure. HAMP, the modification program currently ramping up will follow suit. There will be a relatively small percentage of borrowers who will qualify, modify and perform (and be debt slaves in the process) but the majority even if they qualify will eventually default. Extend and Pretend. Bottom line is, if you've got negative equity of 100K or so reality eventually sets in.


                            Originally posted by jimmygu3 View Post
                            Of course, the government is now essentially the only player in the mortgage lending business. Mortgages that don't conform to their guidelines (e.g. jumbos), either no longer exist or charge hefty premiums. So the mortgage market, and therefore the housing market, is largely in the hands of Freddie & Fannie. If it weren't for them, the housing market would have completely collapsed. They can always decide to keep mortgage rates artificially low, even if we see rising bond yields.
                            Jimmy
                            Agreed. But wouldn't it be interesting if the gubmint got out of the housing business? What would eventually happen? Might it be a backtracking to days of old where local banking/savings institutions actually did their own underwriting/origination/servicing and kept the asset on the books? A few years ago that would sound like heresy. Today it sounds like prudence.

                            Comment


                            • #29
                              Re: Chart: Low, Mid & High Housing Bubble Indices

                              Originally posted by swgprop View Post
                              Agreed. But wouldn't it be interesting if the gubmint got out of the housing business? What would eventually happen? Might it be a backtracking to days of old where local banking/savings institutions actually did their own underwriting/origination/servicing and kept the asset on the books? A few years ago that would sound like heresy. Today it sounds like prudence.
                              I know it was just hypothetical, but I don't think we'll see that for a long time. To see banks keeping loans on their books, look at Jumbo mortgages. They charge a 1.5+% premium over conforming (a.k.a. sure to be sold to a US agency) mortgages, even as they demand twice the down payment and stricter income requirements. Try asking those banks what it would take to get them to carry all new US mortgages on their books. We would be looking at 10% mortgage rates with 75% minimum LTV, etc. Prices would fall another 50% and all those MBSs and mortgages still owned and backed by the government would be underwater and go into default.

                              Since the government has a vested interest in keeping a (second) implosion like this from happening, I think they will actually crowd out what little private mortgage market is left, attempting to manage the housing market through mortgage rates and requirements that the private sector can't compete with. The private mortgage industry has been reduced to originating and servicing Agency loans for the foreseeable future, IMO.

                              Jimmy

                              Comment


                              • #30
                                Re: Chart: Low, Mid & High Housing Bubble Indices

                                Originally posted by jimmygu3 View Post
                                I know it was just hypothetical, but I don't think we'll see that for a long time. To see banks keeping loans on their books, look at Jumbo mortgages. They charge a 1.5+% premium over conforming (a.k.a. sure to be sold to a US agency) mortgages, even as they demand twice the down payment and stricter income requirements. Try asking those banks what it would take to get them to carry all new US mortgages on their books. We would be looking at 10% mortgage rates with 75% minimum LTV, etc. Prices would fall another 50% and all those MBSs and mortgages still owned and backed by the government would be underwater and go into default.

                                Since the government has a vested interest in keeping a (second) implosion like this from happening, I think they will actually crowd out what little private mortgage market is left, attempting to manage the housing market through mortgage rates and requirements that the private sector can't compete with. The private mortgage industry has been reduced to originating and servicing Agency loans for the foreseeable future, IMO.

                                Jimmy
                                Jimmy, any data on conforming vs. nonconforming loans in each low, mid, and high bracket?

                                Comment

                                Working...
                                X