Announcement

Collapse
No announcement yet.

38% Decline? Housing Down 43%-57%: Have We Arrived?

Collapse
X
 
  • Filter
  • Time
  • Show
Clear All
new posts

  • 38% Decline? Housing Down 43%-57%: Have We Arrived?

    Originally posted by EJ View Post
    I’ve been warning of an eventual major correction in real estate since August 2002 and finally called a top in June 2005 after describing the crash process in Jan. 2005 that pretty much lays out what’s happened. More recently I said I expect a 38% correction nationally before the whole sorry episode is over. Well, 38% at least in real terms. Perhaps in nominal terms prices won’t fall so much.
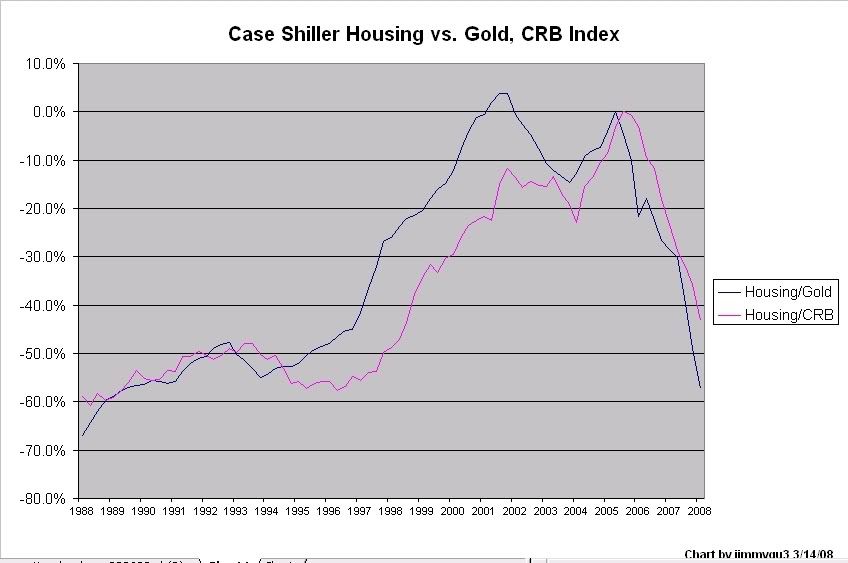
    This chart of the Case-Shiller National Index vs Gold and the CRB Commodity Index shows that housing is already down more than 38% from its 2005 peak. Housing/CRB is 43% off and Housing/Gold is 57% off. EJ, what is your take on that?

    Jimmy


  • #2
    Re: 38% Decline? Housing Down 43%-57%: Have We Arrived?

    Originally posted by jimmygu3 View Post
    This chart of the Case-Shiller National Index vs Gold and the CRB Commodity Index shows that housing is already down more than 38% from its 2005 peak. Housing/CRB is 43% off and Housing/Gold is 57% off. EJ, what is your take on that?

    Jimmy

    Isn't the BBC video clip currently posted on the iTulip home page supremely ironic? It wasn't that long ago when those sleeping on the sidewalks and creating "tent cities" were camping out for the privilege of buying newly released building lots, or condos off-plan in D.C. or Florida.

    For me the height of the insanity was during a trip to Palm Springs in early 2004, and reading about people camping in the desert so they could have a chance to enter a lottery draw for building lots next to Highway 10, pretty well directly over the San Andreas Fault. I told my wife the bubble was about to burst. I was more than a year early [I hadn't yet found iTulip]
    Last edited by GRG55; March 22, 2008, 12:08 AM.

    Comment


    • #3
      Re: 38% Decline? Housing Down 43%-57%: Have We Arrived?

      It's starting to get real ugly in overpriced San Diego. Starting to see houses I've kept an eye on for five years gap down 100K in the space of two months right in the center of the city. I kept saying "I'll have to see it to believe it" - now I'm seeing it. Free-falling ...

      Comment


      • #4
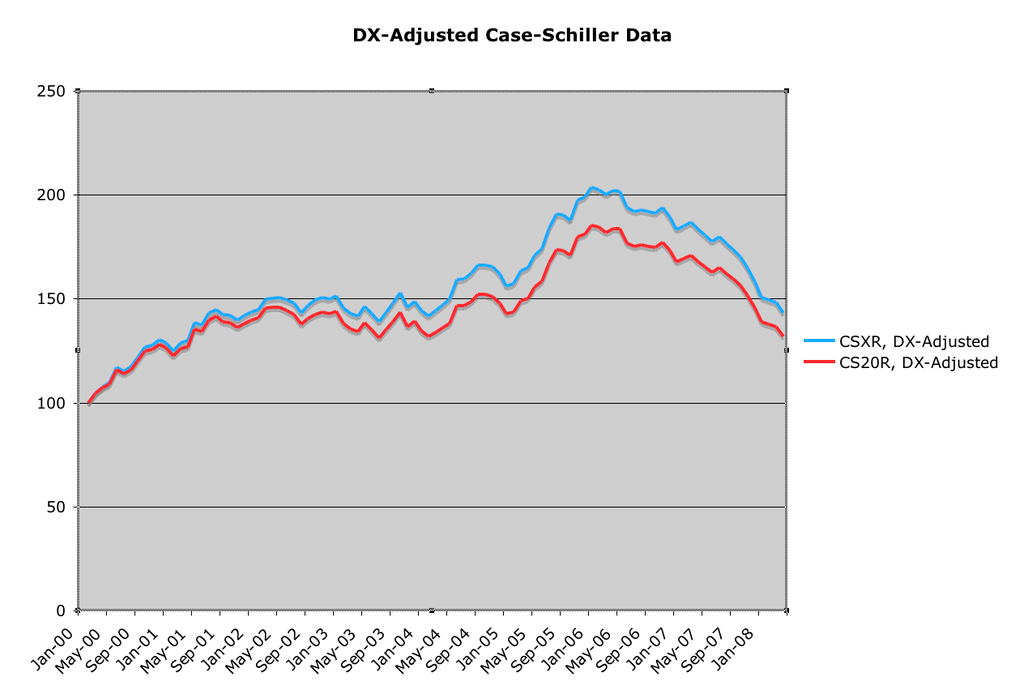
        Chart of Housing Adjusted For Dollar Depreciation

        Here's another chart of the CS Index, this time multiplied by the DX NYBOT $US Index. This effectively takes the dollar out of the equation, or at least shows US housing priced in a basket of currencies. The drop from the April '06 peak is 30%. However it should be noted that the most recent CS data is for Jan '08, and those numbers were used for the Feb, Mar, and Apr calculations. Assuming the CS keeps falling at its average rate of .75%/month, we are really looking at a 32% drop from the peak.

        The total increase since Jan 2000 is 42.3% for the 10-market CSXR and 31.1% for the CSX20. Factoring in world inflation of 2.5% per year (21.6% aggregate), we could say that US housing is 7%-14% higher than its 2000 level, when priced in a basket of currencies and inflation adjusted.

        Comment


        • #5
          Re: Chart of Housing Adjusted For Dollar Depreciation

          These are cool. I think if you plot the base C-S index or median home price values on the same chart, with a right-hand scale, you will find a delay between when your charts show the housing peak in whatever hard value you are using vs the housing peak in dollars. If you adjust the home prices by CPI or your choice of more accurate inflation, so as to show previous (small) housing bubbles, you may see a repeating pattern of this, with a delay of 3 or 4 years both at peaks and subsequent bottoms. This is just coming from a casual observation of a chart I made for "ounces of gold to buy median house" and then overlaying cpi-adjusted median prices. So might be totally wrong, but my thesis is that the "real" bottom will hit before the nominal bottom.

          Comment


          • #6
            Re: 38% Decline? Housing Down 43%-57%: Have We Arrived?

            Originally posted by Lukester View Post
            It's starting to get real ugly in overpriced San Diego. Starting to see houses I've kept an eye on for five years gap down 100K in the space of two months right in the center of the city. I kept saying "I'll have to see it to believe it" - now I'm seeing it. Free-falling ...

            Do you think the banks have factored in the free falling prices in California? I read somewhere that Lehman even wrote back the writedowns they did last year for prime and alt-a debts.

            From past experience during the Asian financial crisis a decade ago, the housing correction don't end until prices in the financial capital, and in the most prestigious district falls by 40% to 50%.

            Comment


            • #7
              Re: 38% Decline? Housing Down 43%-57%: Have We Arrived?

              It could go a lot further down. Factor in

              1. lower (maybe much, much lower) availability of credit, perhaps even far below "normal" periods

              2. higher unemployment

              3. over-reaction to the down side, mirroring the over-reaction to the upside, like "the herd" (aka "the sheeple") are wont to do

              4. reduced friction as internet selling gains steam and all the legal fees and brokerage fees fall. This is a good thing, BUT STILL, house "prices" (total sales price, total purchase price) will fall because of this

              My younger brother kept haranguing me for ages about how US house prices would not decline because house prices are far "stickier" than any other price.

              Comment


              • #8
                Re: Chart of Housing Adjusted For Dollar Depreciation

                Originally posted by zoog View Post
                These are cool. I think if you plot the base C-S index or median home price values on the same chart, with a right-hand scale, you will find a delay between when your charts show the housing peak in whatever hard value you are using vs the housing peak in dollars. If you adjust the home prices by CPI or your choice of more accurate inflation, so as to show previous (small) housing bubbles, you may see a repeating pattern of this, with a delay of 3 or 4 years both at peaks and subsequent bottoms. This is just coming from a casual observation of a chart I made for "ounces of gold to buy median house" and then overlaying cpi-adjusted median prices. So might be totally wrong, but my thesis is that the "real" bottom will hit before the nominal bottom.
                Very interesting point, zoog. I don't have time right now to re-create the charts with the nominal overlay, but here's the data:

                Q4 '01 - First Housing/Gold Peak
                Q2 '05 - Second Housing/Gold Peak
                Q3 '05 - Housing/CRB Peak
                Q4 '05 - DX-Adjusted Housing Peak
                Q2 '06 - Nominal Housing Peak

                I wonder if this "real peak before nominal peak" is characteristic of other asset bubbles? I suppose you could look at it this way: As the top approaches, sellers begin to reinvest gains in other asset classes or currencies. This causes the rate of return on other assets to reverse from underperforming to outperforming the bubble asset, creating a peak in their ratio. The bubble asset, its fuel siphoned off to power other asset classes, then runs on bull market inertia, coasting to its nominal peak.

                Jimmy

                Comment


                • #9
                  Re: Chart of Housing Adjusted For Dollar Depreciation

                  Originally posted by jimmygu3 View Post
                  Here's another chart of the CS Index, this time multiplied by the DX NYBOT $US Index. This effectively takes the dollar out of the equation, or at least shows US housing priced in a basket of currencies. The drop from the April '06 peak is 30%. However it should be noted that the most recent CS data is for Jan '08, and those numbers were used for the Feb, Mar, and Apr calculations. Assuming the CS keeps falling at its average rate of .75%/month, we are really looking at a 32% drop from the peak.

                  The total increase since Jan 2000 is 42.3% for the 10-market CSXR and 31.1% for the CSX20. Factoring in world inflation of 2.5% per year (21.6% aggregate), we could say that US housing is 7%-14% higher than its 2000 level, when priced in a basket of currencies and inflation adjusted.

                  Another to add to the mix: Correlation of home builder stock prices and home price appreciation.
                  Ed.

                  Comment


                  • #10
                    Re: 38% Decline? Housing Down 43%-57%: Have We Arrived?

                    Originally posted by Lukester View Post
                    It's starting to get real ugly in overpriced San Diego. Starting to see houses I've kept an eye on for five years gap down 100K in the space of two months right in the center of the city. I kept saying "I'll have to see it to believe it" - now I'm seeing it. Free-falling ...
                    Well, it does sound like panic selling indeed (near bottom). I'm hearing from a few unbiased sources that the RE could bottom this spring/summer for a time being. The early wave of resets is over, the liquidity is coming back slowly to the banks (I picked up a lot of free 0% balance transfers from credit cards, some to pay for the capital gain tax that is killing me). Obviously, things will get worse later, especially with the second wave of resets in 2009 and when baby boomers start downsizing homes.
                    Last edited by friendly_jacek; April 03, 2008, 10:37 AM. Reason: typos, as usually.

                    Comment


                    • #11
                      Re: Chart of Housing Adjusted For Dollar Depreciation

                      Originally posted by FRED View Post
                      If only you could trade your house with the click of a mouse, housing would track those builder stocks even more closely.

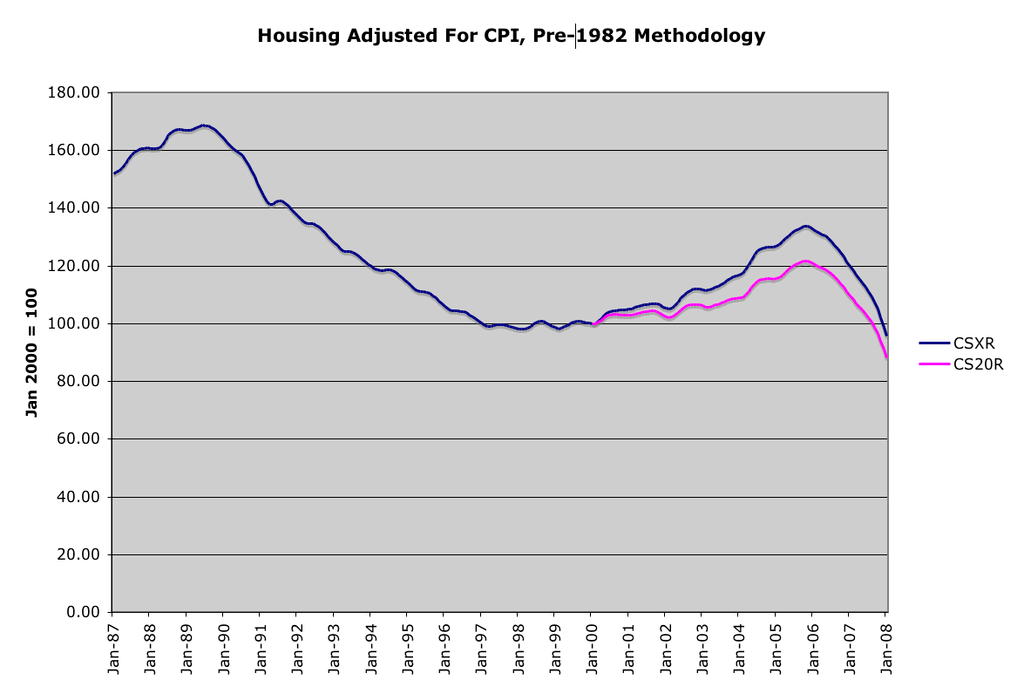
                      Here's another one. The CS indices adjusted for inflation using shadowstats pre-1982 CPI methodology. There is a certain margin of error with this one, as I don't have the shadowstats data. I just interpolated the CPI numbers from their chart. I cross-referenced my cumulative numbers with others on shadowstats and I think this chart probably understates cumulative inflation by about 5%, and certainly does not overstate it.

                      I was really surprised to see that the adjusted CSXR peaked in 1989. Both indices hit their recent highs in November '05, several months before the nominal top. Both are now about 28% off their real peaks.

                      Comment


                      • #12
                        Re: 38% Decline? Housing Down 43%-57%: Have We Arrived?

                        Here's some snapshots of what's happening in San Diego. The serious bloodbath is well under way down here. Starting to see some 2002 and early 2003 prices already and the downturn is progressing briskly.

                        Lots of people's life savings drying up and blowing away like dust down here.

                        The first two homes are ones which I owned (sequentially). Fixed the second one up really nicely (large) to be a property I'd have been glad to keep a lifetime, but it did not "feel right" after the rehab was done, so I sold it right away. Sold it, ironically I think, to an up and coming young Chinese couple (mainland Chinese first generation emigrated to the US) - don't feel too bad for them, she was a CPA and he a highly paid financial analyst - combined income of about 170K, no kids, and two humongous SUV's which did not quite fit into the garage. They are down 100K on the home right now. I don't get smug about it. Merely sincerely and humbly grateful I got out.

                        The third property I located for an EU engineer colleague who arrived in San Diego on an H-1B visa, married an American girl and stayed on. He was itching to buy a house at Christmas of 03 so I helped him locate this one. He's still there. Made a very good buy indeed, even at 2003 prices, but his 150K equity cushion (what it appreciated after he bought it) has evaporated to zero as of this months. He wanted to buy some shoebox in a not so great part of town and I found him this one instead below market. He was a haughty guy - I never got a murmur of thanks from him for helping him find a discounted property. Without the carefully selected purchase he'd be at least 50K underwater by now.

                        It's looking "real bad" all over down here. When it starts to look that scary even just to observers outside the market it's probably really getting ugly for people inside it. Downward momentum the past two or three months seems to be accelerating.

                        SAN DIEGO HOME NUMBER ONE.jpg

                        The following one was the "keeper", sold immediately after renovation.

                        SAN DIEGO HOME NUMBER TWO - FIXER.jpg

                        Last one is the discounted property located for a colleague in late 2003. It's in fact sparing him from negative equity a lot better than others.

                        SAN DIEGO HOME NUMBER THREE - FOUND FOR AN EU FRIEND - WHO BOUGHT IN LATE.jpg

                        Comment


                        • #13
                          Re: Chart of Housing Adjusted For Dollar Depreciation

                          Originally posted by jimmygu3 View Post
                          The CS indices adjusted for inflation using shadowstats pre-1982 CPI methodology. There is a certain margin of error with this one, as I don't have the shadowstats data. I just interpolated the CPI numbers from their chart. I cross-referenced my cumulative numbers with others on shadowstats and I think this chart probably understates cumulative inflation by about 5%, and certainly does not overstate it.

                          And the big picture since 1900:

                          http://www.NowAndTheFuture.com

                          Comment


                          • #14
                            Re: 38% Decline? Housing Down 43%-57%: Have We Arrived?

                            I'm reporting average 20% Year on Year price declines in some properties I've been tracking in central San Diego. That is the decline in one year. Price butchery going on down here. This past weekend I went to see two properties, one a small 1100 square foot cottage, in good condition and not too unattractive in an average community inthe center of town on a "blowout sale" (bank owned). The price? One hundred and seventy five thousand dollars. That's for a detached house in an area where average home prices were a half million two years ago. Admittedly it's small and very modest - but the price is out of disneyland for San Diego in the 2000's.

                            Then another property on a premium street in one of the tonier parts of central San Diego, this one surrounded by 800K ++ homes in a very affluent setting. 4 bedroom, good condition, nice big eaves on the roof and gracious altogether at 1800 square feet. The price? Two hundred thousand dollars beginning bid at auction, and the auctions are undersubscribed. I'm therefore agreeing with Jimmygu3 - these are the harbingers of a market where nominal prices will level of or diminish their steep downturn at least in this city. The rest is fiat currency destruction. If I wasn't reading so much iTulip I would have pounced on one of the above two properties at those prices.

                            Comment


                            • #15
                              Re: 38% Decline? Housing Down 43%-57%: Have We Arrived?

                              Originally posted by Lukester View Post
                              I'm reporting average 20% Year on Year price declines in some properties I've been tracking in central San Diego. That is the decline in one year. Price butchery going on down here. This past weekend I went to see two properties, one a small 1100 square foot cottage, in good condition and not too unattractive in an average community inthe center of town on a "blowout sale" (bank owned). The price? One hundred and seventy five thousand dollars. That's for a detached house in an area where average home prices were a half million two years ago. Admittedly it's small and very modest - but the price is out of disneyland for San Diego in the 2000's.

                              Then another property on a premium street in one of the tonier parts of central San Diego, this one surrounded by 800K ++ homes in a very affluent setting. 4 bedroom, good condition, nice big eaves on the roof and gracious altogether at 1800 square feet. The price? Two hundred thousand dollars beginning bid at auction, and the auctions are undersubscribed. I'm therefore agreeing with Jimmygu3 - these are the harbingers of a market where nominal prices will level of or diminish their steep downturn at least in this city. The rest is fiat currency destruction. If I wasn't reading so much iTulip I would have pounced on one of the above two properties at those prices.
                              Sheesh, maybe I should sell my house in Atlanta and move out to California where the housing's cheap! ;)

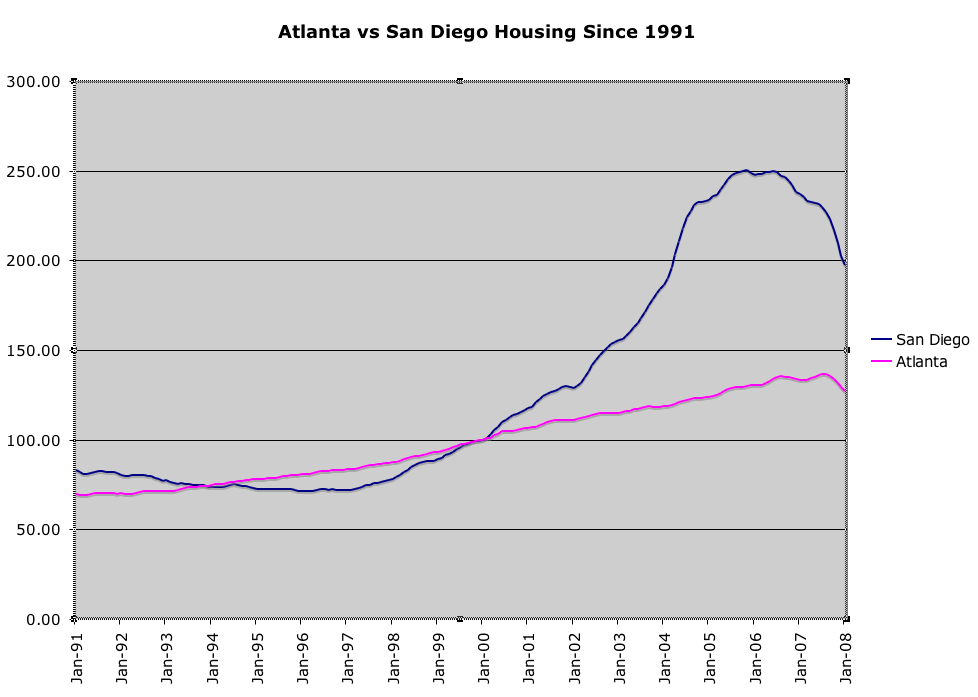
                              I was starting to wonder if ATL is in for the kind of freefall you're experiencing, but as you'll see from the chart below, SD housing prices doubled from June '01 through November '06, while ATL was up a mere 23%.


                              When my wife and I chose our current house in 2004, I knew the housing market was likely to take a dive, but we found a bargain in one of the best historic neighborhoods and jumped on it. Many formerly bad areas nearby have begun to turn over and get fixed up over the last 10 years and people have made a bundle in many cases. I chose to buy a house that's 20-30% more expensive than those in the dodgier areas, with the theory that when the crisis hits, the weakest neighborhoods will fail first and that if the up-and-coming areas do well, that the best areas will do even better. In other words, there will always be a premium for the best neighborhoods.

                              The question I have for you, Lukester, and others in cities being hit by the bursting bubble, is how different areas and neighborhoods are being affected. How are the relative price drops in the city, suburbs and exurbs? What about established neighborhoods vs up-and-coming ones? Ritzy vs decent vs rough? Are the historically strong neighborhoods faring better than the 'next big thing' from 5 years ago or are spreads narrowing?

                              Thanks.

                              Jimmy

                              Comment

                              Working...
                              X