Announcement

Collapse
No announcement yet.

Morningstar Interviews Jeremy Grantham

Collapse
X
 
  • Filter
  • Time
  • Show
Clear All
new posts

  • Morningstar Interviews Jeremy Grantham

    Morningstar has a brief, seven minute interview with Jeremy Grantham. Grantham opines that the market is not yet in a bubble but is close: another 5% or 10% and we're there. He also feels that the markets have a few more years to go before a blowout.

    http://www.morningstar.com/Cover/vid...aspx?id=701816

    Anyone know if a video of his presentation from the Morningstar Conference is available anywhere?

  • #2
    Re: Morningstar Interviews Jeremy Grantham

    "Not quite yet" and "just a little more" . . . haven't we heard this before.

    The Money Printers’ M&A Ball——Where The Debt Zombies Go To Mate

    Fed governor Jerome Powell is living proof that we are heading for another calamitous financial meltdown. This clueless monetary apparatchik averred yesterday that the Wall Street casino is in the pink of good health with no evidence of irrational exuberance in sight. Said the former LBO guy from Carlyle Group,

    “Things are fully priced, but I really don’t see bubble territory,” Powell said. “I can’t say we’re at significant risk of financial instability.”

    Maybe he should glance at the financial papers, starting with the Merger Monday stories. Comes word this week that two more bloated debt zombies plan to mate—–and their financials scream bubble mania.

    To wit, Energy Transfer Equity (ETE), which has a TEV (total enterprise value of market equity plus debt) of $89 billion, plans to acquire Williams Companies (WMB), which sports a TEV of $79 billion. Needless to say, this is not about smart new technology or some other cutting edge mousetrap. The resulting TEV of $168 billion—-or a tad less than the GDP of Greece’s woebegone 11 million citizens—–is all about rolling-up dumb old technology into a bigger bundle.

    The proposed merger’s massive TEV purportedly measures the value of approximately 100,000 miles of steel pipe; a few thousand pumping stations which are based on 50-year old natural gas engine designs that work by the simple expedient of siphoning fuel from the flowing gas; and various and sundry liquefaction and gasification plants that extract liquids along the way.

    But what this combination really measures is the degree to which the Fed’s insane QE and ZIRP policies have transformed business executives into deal junkies and the corporate securities market into an out-of-control arena of rank speculation.

    Let’s start with the cash flow of this pending nuptial. In the LTM ending in March, the combined companies generated exactly $10 billion of EBITDA. That doesn’t seem like much against $168 billion of TEV, but that’s not the half of it. It seems that the combo also consumed $6.2 billion of cash on CapEx——that is, laying pipe and maintaining pumping stations.

    So we are in fact talking about just $3.8 billion of net cash flow to service the return requirements of $168 billion of capital. That makes the EBITDA less CapEx multiple 44X.

    It also makes the valuation flat out absurd. The net cash flow of the latest technology whiz-bang is rarely worth 44X. But when it comes to cold steel pipes buried in the US energy patch and gas transmission pipelines that are heavily regulated by state and Federal authorities, this towering valuation multiple is just plain nuts.

    The Wall Street stock touts, of course, say not to worry because both companies have been growth machines and there is plenty of post-merger synergies. As to the former point, for example, they reassure their retail mullets that the heavy CapEx which eats up the EBITDA is front-loaded. Therefore, down the road a spell the investment phase will end and these companies will become veritable corporate cash machines.

    Not on the record—-not even close. During the 40 quarters from 2005 through 2014, ETE generated $19 billion of EBITDA and consumed $20 billion in CapEx. Likewise, WMB generated $31 billion of EBITDA and consumed $28 billion of CapEx.

    In short, an entire decade ought to be more than ample time to prove up an investment now/cash flow latter proposition. And that’s especially apt in the case of businesses which have low value-added and depend upon decades-old, pedestrian technology.

    So here’s the skunk in the woodpile. During the entire decade ending in 2014, this prospective combination managed to churn out $50 billion of EBITDA and spent $48 billion on CapEx. It goes without saying that $2 billion of net cash flow is nothing to write home about in any circumstance, but most especially in this case.

    Why? It seems that a goodly portion of even the modest EBITDA indicated above was acquired. That’s right. Both companies have been serial deal machines, and over the last decade spent upwards of $16 billion on acquisitions designed to roll-up the pipe, so to speak.

    That begs the question as to how they managed to spend $64 billion over a decade gathering assets—-that is, building via CapEx and buying via M&A—-when they only had $50 billion of cumulative EBITDA. And that’s not the half of it, either.

    It seems that $168 billion of market capital demands its dues. Thus, the combined dividend payments of the two companies totaled $19 billionover the decade, and that consisted of hard cash.

    After all, the Wall Street pitch to the punters is not only that these pipeline companies have been high flyers on the stock exchange, but they are also real safe because they pay a big dividend, too. So what could possibly go wrong?

    Well, once upon a time investors actually felt that companies should “earn” their dividend and still have enough cash left over to reinvest in the company’s future. Not these two. During the 2005-2014 decade their combined net income was just $9 billion, meaning that they did not “earn” their dividend; they actually distributed 211% of their meager profits to shareholders.

    Then there is the matter of debt. The two started with $10 billion of it in 2005, and that has now grown like Jack’s beanstalk to $56 billion. And, yes, even in today yield hungry bond market where the Fed has crushed savers with massive QE and 80 months of ZIRP, junk bond holders demand to get paid at least something. In fact, interest payment have amounted to another $12 billion over the period for the two prospective merger partners combined.

    The have also had material tax payments owing to some fancy financial engineering that we will get to in a moment. But at this point, a good old “sources and uses” tabulation shows exactly how lopsided the whole scheme has become.

    Over the last decade the two companies spent cash on CapEx, M&A deals, dividends and interest payments. Those items add up to $95 billion. On the other hand, combined EBITDA was just $50 billion.

    That’s right. Over the course of the last decade, this week’s wanna be mega-merger involves companies that spent 2X more than their available cash flow. Perhaps their CEOs and boards should be considered prime candidates for the US Congress!

    And like their Washington comparables, they closed the gap by borrowing. A good part of that was the $46 billion uptake in balance sheet debt mentioned above. But for good measure both companies generated some additional cash by creating MLPs and selling a minority interest to yield hungry investors. These interests now total $33 billion.

    By contrast, back in 2005 the combined balance sheets of ETE and WMB sported just $1.4 billion of liabilities for minority interests. So effectively both companies have been funding their massive cash flow gap by selling off the “back forty” to the even greater fools who bought the shares of their MLP subsidiaries.

    For instance, ETEs master limited partnership affiliate, Energy Transfer Partners, is publicly traded and has a TEV of $58 billion. But its cash flow multiple is implicitly infinite—-since its $3.6 billion of LTM EBITDA was more than swallowed-up by $5.1 billion of CapEx.

    Likewise, the Williams Companies’ MLP, Williams Energy Partners (WPZ), has a TEV of $48 billion. That’s supported by $1.5 billion of EBITDA during the 12 months ended in the March quarter—less $1 billion of CapEx. Stated differently, WPZ is valued at 92X net cash flow!

    In any event, there is a whole lot of financial engineering going on here and it requires close attention to keep track of which shell is hiding the pea. But its abundantly clear that this house of cards would have never seen the light of day in an honest free market.

    Indeed, with $56 billion of combined debt and only $3.5 billion of net cash flow, its doubtful that the combination is even worth its debt at par. After all, pipelining–especially in the wake of the shale bust in both natural gas and oil—-is not exactly a growth business.

    So 16X is not merely a pretty fulsome multiple; its actually an impossible one in an honest free market where the Fed has not lowered its big fat thumb on the entire term structure of interest rates. Absent the Fed’s baleful intrusion, therefore, the interest carry cost of the combination would far exceed the available cash flow.

    For instance, a company leveraged to this extreme degree would never be able to borrow 3-year money at 2.5% and 10-year money at 4.75%, as ETE did a few days ago. Nor would the combined company be able to fund its debt at an average interest rate of 4.1%, as is the case today.

    Instead, add 200 basis points to reverse out the Fed’s interest rate repression and 200 basis points for junk bond risk in a market not desperately parched for yield. That gives you an interest bill on its $56 billion debt of $4.5 billion per year or 30% more than the combinations $3.5 billion of net cash flow.

    Needless to say, under these circumstances something would go bump in the night real fast. And even if CapEx were sharply pared and the newly marrieds managed to skin by in paying their interest bill, there is still the matter of the dividend bill.

    Right now that’s $5.4 billion per year and the homegamers who piled into ETE and WMB surely count on it. But in an honest debt market, there would be no cash flow left to pay it. Indeed, there would be no case whatsoever for the combined equity market cap at today’s closing stock prices of $78 billion.

    It’s just bottled air. In fact, the actual tangible book equity of the two companies was negative $15 billion as of the March quarter end. Only in a world in which the central bank has massively falsified the cost of debt and encouraged rampant speculation in stocks and other risk assets is it possible to value an endless river of red ink and negative book value at $78 billion.

    Yet there is nothing special about the proposed hook-up between these two debt zombies. It happens week in and week out. Indeed, M&A volume last year was already nearly back to its fevered 2007 peak, and the run rate year-to-date is well over $1 trillion.


    And today’s mega-merger illustrates another aspect of the rampant financial bubbles that Powell and the other Fed heads profess not to see. Namely, that this frantic M&A activity is overwhelmingly driven by Wall Street financial engineering and the endless speculative appetites that have been engendered by years of Fed money printing.

    The claim that there are business synergies to be obtained by combining 100,000 miles of pipeline is just plain bunk. The cost of pipeline operations are determined by mileage and thruput, and would be little different if this proposed $168 billion monument to financial engineering and speculation were divided into 10 separate companies or even 25.

    In the prosaic world of pumping hydrocarbons through steel pipe there are no economies of scale. Period. What is claimed to be synergies from horizontal mergers could be just as easily obtained by means of out-sourcing to specialist service companies. And that’s exactly what smaller pipeline asset groupings would do.

    So what we have in this case and most of today’s incessant M&A activity is just one more manifestation of bubble finance. These deal-driven houses of cards add nothing to the productive capacity or efficiency of the real main street economy. Instead, they are just another mechanism for generating windfall gains in the casino.

    So its no wonder a Fed apparatchik like Jerome Powell sees no bubbles. After two decades of Fed money printing, massive financial engineering has become a way of life in the Wall Street casino, even as it drains the main street economy of the vital ingredients of capitalist growth. Namely, investment in productive assets and enterprenurial focus on efficiency, innovation and growth.

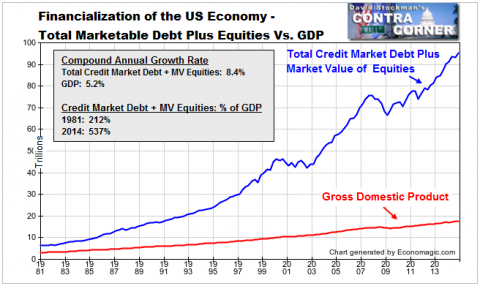
    In fact, this particular mega-merger is just one example of the drastic financialization of the US economy over the last several decades—especially after Alan Greenspan took command of the Fed in 1987. In the subsequent 27 years, the combined value of credit market debt plus non-financial corporate equity in the stock markets soared from $12 trillion to $93 trillion, and from 2.3X GDP to 5.5X.


    Total Marketable Securities and GDP – Click to enlarge

    How did we get to the fantastic disconnect between the real economy (GDP) and the financial system depicted above? In no small part it was through the central bank enabled debt spree and endless financial engineering represented by today’s iteration of the M&A ball.

    Stockman
    Last edited by don; June 25, 2015, 07:08 AM.

    Comment

    Working...
    X