Announcement

Collapse
No announcement yet.

Daily Graphs & Charts

Collapse
X
 
  • Filter
  • Time
  • Show
Clear All
new posts

  • #46
    Re: Daily Graphs & Charts

    PRESENTING: The biggest contradiction on Wall Street.
    Sell-side analysts are at historic levels of stock market bearishness, as this BofA indicator shows. (ViaBarry Ritholtz)

    And on the other hand, actual portfolio managers are more bullish than they have been in years.


    http://www.businessinsider.com/prese...-street-2013-1
    "It's not the end of the world, but you can see it from here." - Deus Ex HR

    Comment


    • #47
      Re: Daily Graphs & Charts


      http://ilovecharts.tumblr.com/post/4...zine-obama-has
      "It's not the end of the world, but you can see it from here." - Deus Ex HR

      Comment


      • #48
        Re: Daily Graphs & Charts

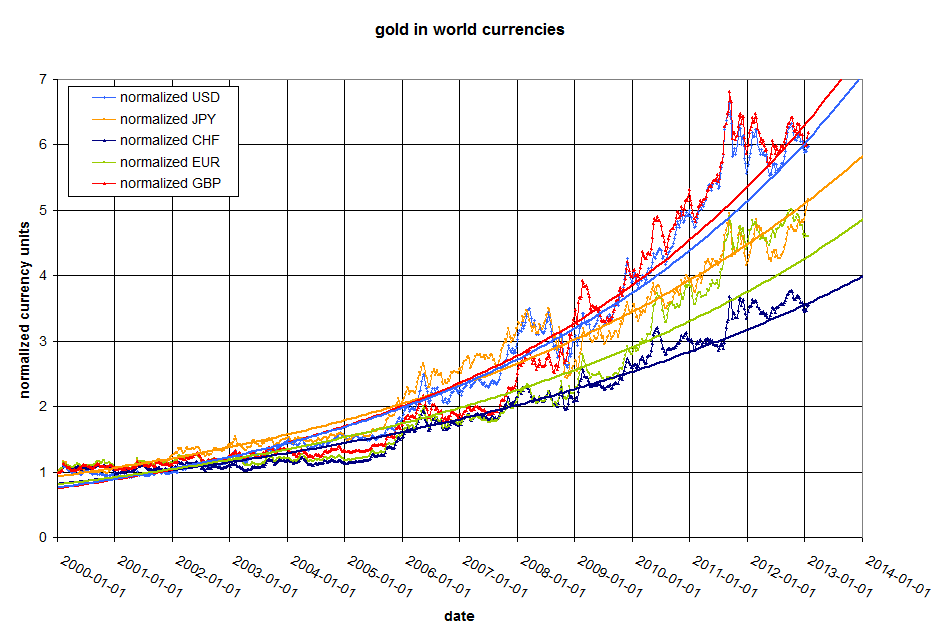
        À propos of nothing at all, this is a thought I have been playing with today:

        James Turk makes much of this chart. I don't see anything too exciting here. I guess the important thing is that there have been no big moves away from trend line ( apart from the Euro which is far above it's trend line).
        Last edited by globaleconomicollaps; February 18, 2013, 12:36 PM.

        Comment


        • #49
          Re: Daily Graphs & Charts


          http://www.zerohedge.com/news/2013-0...lay-retirement


          Final nail in the coffin of the theory that the low US labor force participation rate since 2008 was due to retirees.


          http://www.theoildrum.com/node/9808


          Coal consumption in the US. ^


          Not to be confused with Energy Consumption in the U.S., by sector.


          source: EIA Monthly Energy Review December 2012


          Current estimates suggest that solar might be as cheap as coal by the end of the decade, and half the cost of coal by the end of the next decade. When applied to electricity prices this predicts that solar generated electricity in the US will descend to a level of 12 cents (7 pence) per kilowatt hour by 2020, possibly even 2015 for the sunniest parts of America. (hat-tip, SilverIsTheNew blog)


          http://blog.uncommonwisdomdaily.com/...t-cheaper-9232


          http://www.businessinsider.com/how-s...lotelli-2013-2


          http://www.washingtonpost.com/blogs/...three-decades/


          Despite the non-recovery in vehicle miles driven.


          http://www.econbrowser.com/archives/...ing_views.html


          A leveling off trend in US GDP does not keep the CBO from upholding it's tradition of predicting that a closing of the output gap is JUUUUUUST around the corner.


          Their projection of potential GDP also looks optimistic by my standards.


          http://future.aae.wisc.edu/data/annu...plete&tab=feed


          http://www.businessinsider.com/name-...-the-us-2013-2


          A/R stands for accounts receivable. trade receivables. they're kind of a big deal.


          http://www.businessinsider.com/fx-vo...d-bears-2013-2


          putting the recent Japanese yen weakening in historical perspective ...


          In 2012, FT asked a large group of investors whether they thought the stock market was up or down in 2009, 2010 and 2011. Let me reiterate that this set of questions was asked after the three-year period was in the books. As you can see in the graphic below, around half of surveyed investors weren't even aware the market had gone up each year post-crisis. And of course, we can now add 2012 to the string. I'm guessing if FT were to conduct the survey again about 2012, a larger percentage of investors would at least be aware of last year's stellar 16% gain for the S&P 500® Index.

          http://www.businessinsider.com/inves...returns-2013-2


          http://www.businessinsider.com/byron...-coming-2013-1


          Strong stock market performance in the first month of a year predicts a strong yearly gain.


          In the same vein:


          http://www.businessinsider.com/stock...ce-1928-2013-2


          http://grist.org/climate-energy/chin...t-taming-coal/


          I don't know why they would make such claims but it sounds like patent bs. Unless of course they are wisely projecting for their "growth miracle" to come to an abrupt end in the face of faltering western consumption demand. Then it makes perfect sense.


          ps. chart should probably say "excluding".

          ---

          Some charts I've been posting in another place. Might as well dump them here.
          "It's not the end of the world, but you can see it from here." - Deus Ex HR

          Comment


          • #50
            Re: Daily Graphs & Charts


            Notice that in two of the last three bear markets, a major world war broke out. We're basically overdue for one based on that trend. YIKES.
            "It's not the end of the world, but you can see it from here." - Deus Ex HR

            Comment


            • #51
              Re: Daily Graphs & Charts

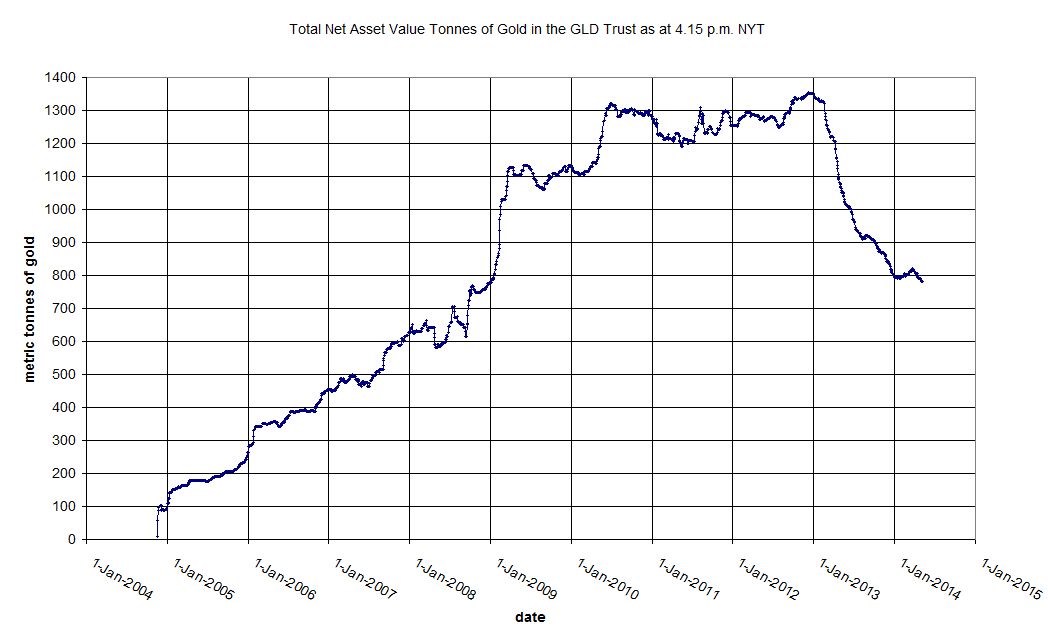
              Gold has been pouring out of the GLD trust at a terrific rate:


              The Turd has a good piece on this:
              http://www.tfmetalsreport.com/blog/4...ncumbered-gold

              These are not the largest outflows from the trust, but there is a consistent four month trend right now.

              What does this mean? I don't know. This is an article that explains how GLD works.
              http://fofoa.blogspot.fr/2013/04/open-window-forum.html

              He also wrote an article called "Who is draining GLD"

              Comment


              • #52
                Re: Daily Graphs & Charts

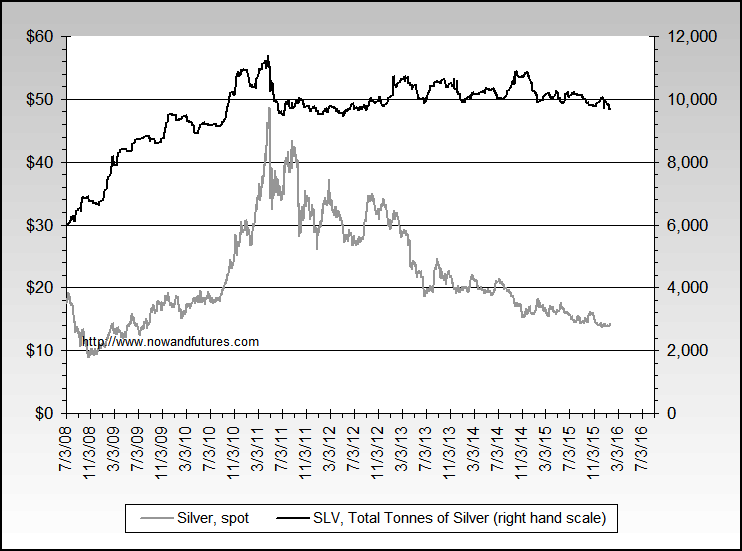
                His most interesting points in my opinion are what's happening with SLV as the price has dropped, and his conjecture that paper gold is being replaced with physical.


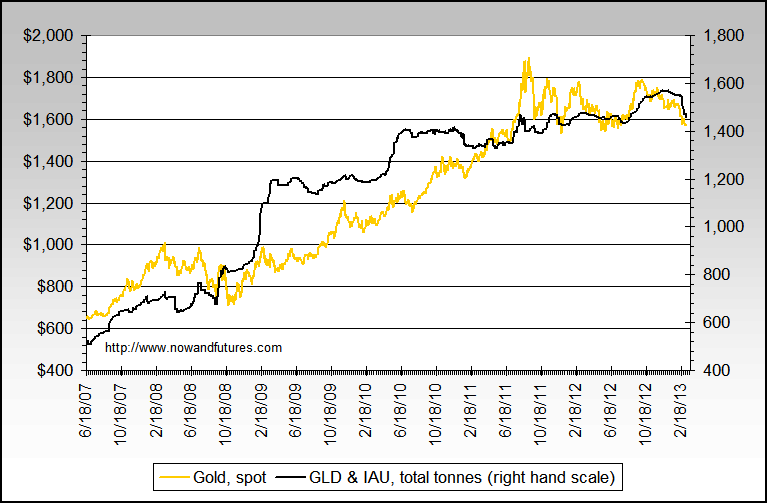
                Here's a longer term picture of GLD plus IAU.

                http://www.NowAndTheFuture.com

                Comment


                • #53
                  Re: Daily Graphs & Charts

                  As Jesse Might say "Matières à Réflexion"

                  Comment

                  Working...
                  X