Announcement

Collapse
No announcement yet.

2/27/07--Beginning of a Bear Market?

Collapse
X
 
  • Filter
  • Time
  • Show
Clear All
new posts

  • #16
    Re: 2/27/07--Beginning of a Bear Market?

    Originally posted by Finster
    Of course your point is valid regardless ... even without the scale adjustments the general form of the plots is similar. The peaks and valleys correspond pretty well.

    But it wouldn't really take any fiddling to get them to match up much more closely. Just plot the stock prices in terms of gold rather than dollars. The resemblance will be striking enough to make your chart heart skip a beat.
    http://www.nowandfutures.com/grins/kinky.wav ;)

    I'm a little hesitant to plot stuff in terms of gold since it doesn't hold well over the last 35 years or so, but it sure is true since the markets started to turn back towards hard assets. One of these days, I'll run across some decent long term PPP data and maybe then I can do it more fairly.

    I should note and agree with you that it was EJ who originally brought up the whole area here some months ago.
    http://www.NowAndTheFuture.com

    Comment


    • #17
      Re: 2/27/07--Beginning of a Bear Market?

      Originally posted by bart
      ...since it doesn't hold well over the last 35 years or so, but it sure is true since the markets started to turn back towards hard assets.
      ???:confused:

      Sure it holds. You see the cycle go back and forth between actual assets and claims on assets:


      Originally posted by bart
      I'm a little hesitant to plot stuff in terms of gold ...
      Okay. I'll bite again. I'll do it. Got a couple household chores to do and hopefully will get it posted here later today.
      Finster
      ...

      Comment


      • #18
        Re: 2/27/07--Beginning of a Bear Market?

        Here’s a chart of the S&P 500 in terms of gold from 1920-1945, overlaid with the same displaced from exactly seventy years later - that is, from 1990-2015 (though the data extend only through March 3 of 2007). Also, note that although the S&P 500 itself dates only back to 1957, the Cowles Foundation at Yale University has constructed an index extending back further using compatible methodology, and made it available online in conjunction with Professor Robert J Schiller’s book Irrational Exuberance. The below plot is simply the S&P (extended by the Cowles Index), converted from USD into ounces of gold, with taking of the natural log and adding two for plotting purposes.

        Last edited by Finster; March 04, 2007, 02:56 PM.
        Finster
        ...

        Comment


        • #19
          Re: 2/27/07--Beginning of a Bear Market?

          As does EJ's "Real Dow" graph on the front page, this would suggest that the serious post-bubble drop in stocks has yet to occur.

          Comment


          • #20
            Re: 2/27/07--Beginning of a Bear Market?

            Originally posted by WDCRob
            As does EJ's "Real Dow" graph on the front page, this would suggest that the serious post-bubble drop in stocks has yet to occur.
            At least in gold terms. Conceivably the Fed could inflate and manage to depreciate the dollar faster than the market, leaving the averages nominally levitated.

            But that's why it's illuminating to show the prices of stocks in an alternative - and not so easily devalued - form of money. Looked at this way, it's interesting to note that over the entire 25-year span from 1920 to 1945, stock prices went a net nowhere as priced in gold. If the same were to hold true from the start of the upper line in that chart, the one beginning in 1990, either the S&P would have to decline by some 60% while gold prices held steady, or remain flat while gold increased by about 2.5 times over the next seven-and-change years. And if the stock market actually rose in nominal terms over that time frame, the gold would have to rise proportionately more than 2.5 times.

            Any combination that would increase the price of gold by 2.5 times relative to the S&P 500 would get us there. History never repeats exactly, but I am quite confident that gold prices are indeed going to substantially outperform stock prices over the next few years.
            Last edited by Finster; March 04, 2007, 05:42 PM.
            Finster
            ...

            Comment


            • #21
              Re: 2/27/07--Beginning of a Bear Market?

              Originally posted by Finster

              Any combination that would increase the price of gold by 2.5 times relative to the S&P 500 would get us there. History never repeats exactly, but I am quite confident that gold prices are indeed going to substantially outperform stock prices over the next few years.
              That's what I'm banking on. I expect to buy the market for 5% of what it costs today, in gold terms, at some point in a few years. That's how I read history and if anything, it could get even cheaper...

              I don't see a thing wrong with holding gold and then eventually seling the gold and buying stocks...

              Comment


              • #22
                Re: 2/27/07--Beginning of a Bear Market?

                Originally posted by grapejelly
                That's what I'm banking on. I expect to buy the market for 5% of what it costs today, in gold terms, at some point in a few years. That's how I read history and if anything, it could get even cheaper...

                I don't see a thing wrong with holding gold and then eventually seling the gold and buying stocks...
                1. your 5% is a bit different than predicting gold to rise 2.5x relative to stock. that would come out to a 40% price in gold, not 5%. you are predicting something far more drastic, for gold to rise 20x relative to stocks. come to think of it, though, the current dow:gold ratio is around 20, and it could indeed go to 1, as it did in 1980, so perhaps what you predict will come to pass.

                ++++++++++++++++++++++++++++++++++

                2. we should be careful in assuming the curves will continue to parallel that of 70 years ago. if i recall, there were some exciting global events in the late 1930's into the mid 1940's. this is not to say that we don't live in interesting times, ourselves....

                Comment


                • #23
                  Re: 2/27/07--Beginning of a Bear Market?

                  Originally posted by grapejelly
                  That's what I'm banking on. I expect to buy the market for 5% of what it costs today, in gold terms, at some point in a few years. That's how I read history and if anything, it could get even cheaper...

                  I don't see a thing wrong with holding gold and then eventually seling the gold and buying stocks...
                  JK has a good point ... 5% seems a little on the aggressive side. But the general idea is sound. I also wouldn't attempt to go 100% gold and then switch to 100% stock. Too many things can go wrong. My preference is to start with a general long-term asset allocation, overweight gold near term, and gradually shift to an underweight over time as conditions warrant. Not only do you avoid the risk of switching at the wrong time, but also the temptation to bail on your strategy due to potentially extreme volatility.

                  Originally posted by jk
                  1. your 5% is a bit different than predicting gold to rise 2.5x relative to stock. that would come out to a 40% price in gold, not 5%. you are predicting something far more drastic, for gold to rise 20x relative to stocks. come to think of it, though, the current dow:gold ratio is around 20, and it could indeed go to 1, as it did in 1980, so perhaps what you predict will come to pass.

                  ++++++++++++++++++++++++++++++++++

                  2. we should be careful in assuming the curves will continue to parallel that of 70 years ago. if i recall, there were some exciting global events in the late 1930's into the mid 1940's. this is not to say that we don't live in interesting times, ourselves....
                  You can say that again, JK. On the other hand, there are some compelling reasons to suspect that even if history doesn't repeat, it will at least rhyme. Not least among them is that it already has at least once. By my count, this is the third time since the inception of central banking here in the US that we've seen this general kind of pattern developing, not just the second. Curiously, another roughly similar cycle appeared about midway between this cycle and the first one. Below is a modified version of the above chart, showing not only 1920-1945 & 1990-2015, but also 1955-1980.

                  As an aside, it is also interesting to note that US stock prices have made zero net progress in gold terms over the past 35 years. This underscores a point I made elsewhere about the dividend yield on stocks being a good proxy for the prospective real return you can expect. Given today's very low yield, prospective real stock returns are not especially promising...

                  Last edited by Finster; March 04, 2007, 09:52 PM.
                  Finster
                  ...

                  Comment


                  • #24
                    Re: 2/27/07--Beginning of a Bear Market?

                    Finster, I'm having trouble converting the log scale into real #s. If stocks fell to .5 again on your chart, where would that leave them? ~2000 (i.e. 1/6th)?

                    Oh. Nevermind. There's a denominator here too, so it would depend on the price of gold. (??)

                    And am I reading your chart right that in 1980 stocks measured in gold were worth half what they had been worth 30 years earlier?

                    Finally, thanks for making the point multiple times that dividend yields are a likely predictor of real stock returns over the long run. I didn't follow previously, but it made sense this time around.
                    Last edited by WDCRob; March 05, 2007, 08:03 AM.

                    Comment


                    • #25
                      Re: 2/27/07--Beginning of a Bear Market?

                      Originally posted by WDCRob
                      Finster, I'm having trouble converting the log scale into real #s. If stocks fell to .5 again on your chart, where would that leave them? ~2000 (i.e. 1/6th)?

                      Oh. Nevermind. There's a denominator here too, so it would depend on the price of gold. (??)

                      And am I reading your chart right that in 1980 stocks measured in gold were worth half what they had been worth 30 years earlier?

                      Finally, thanks for making the point multiple times that dividend yields are a likely predictor of real stock returns over the long run. I didn't follow previously, but it made sense this time around.
                      Sorry about the difficulty in translating the log scale, WDC. When charting this kind of stuff, it's the lesser of the evils. Plotting this linear would create an unacceptable visual distortion.

                      For plotting purposes, the vertical scale is the natural log of the S&P in ounces of gold plus two. The "plus two" part is totally arbitrary, and all it does is shift the whole line above zero. To deconstuct it, we can just apply the reverse. Subtract two, and raise e to that power. Starting with 0.5, we get exp(-1.5), or about 0.2231.

                      Now remember the S&P 500 is conventionally quotes in dollars, not gold, so this says nothing about the S&P as measured in dollars. Rather that this is the ratio of the S&P 500 to the price of gold. So a value of 0.5 on the chart corresponds to the S&P between 1/5-1/4 of the price of gold, or looked at the other way, a price of gold in the range of 4-5 times the S&P 500 index.

                      Just for illustration, then, if we assume today's dollar price of gold of ~640, this would put the S&P 500 at 142.80. An incredible ~90% drop. Looked at the other way, if we assume today's dollar price of the S&P of about 1400, this would translate into an equally incredible near dectupling of the gold price to around $6,274 per ounce.

                      It bears emphasizing this uses your assumption of that 0.5 line on the chart. I am not forecasting that, but it does give you an idea of the possible. In fact at the end of 1980 the S&P did indeed stand at about 109.30 versus a gold price of about 543.30 per ounce. This was near the extreme for the cycle. IMO no one should be investing on the basis of expecting such an extreme, but in qualitative terms it is eminently reasonable to expect substantial movement in that direction.
                      Finster
                      ...

                      Comment


                      • #26
                        Re: 2/27/07--Beginning of a Bear Market?

                        Originally posted by Finster
                        Just for illustration, then, if we assume today's dollar price of gold of ~640, this would put the S&P 500 at 142.80. An incredible ~90% drop. Looked at the other way, if we assume today's dollar price of the S&P of about 1400, this would translate into an equally incredible near dectupling of the gold price to around $6,274 per ounce.

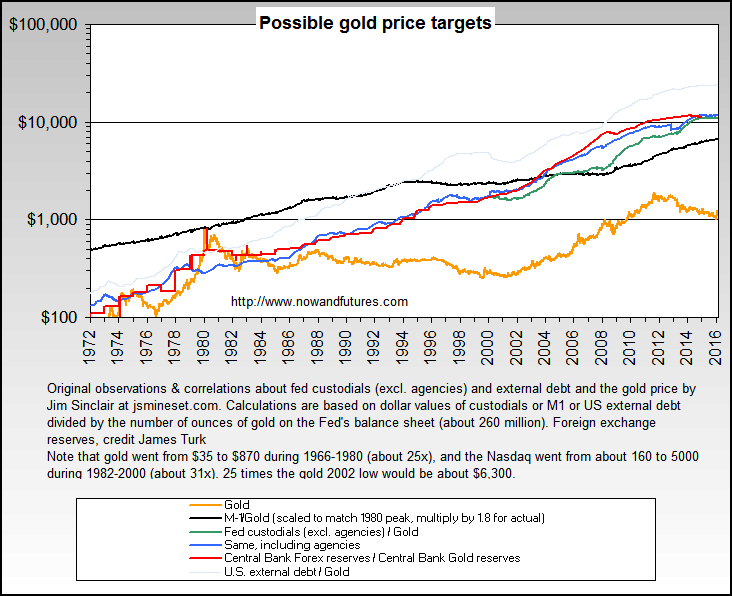
                        And here's another out there view of possible gold targets, based on relationships between two money numbers and some logic.


                        The M1/gold line simply shows what gold could be prices at now if gold again is priced to match just the total amount of outstanding cash and checking account balances as it did in 1980. The other one, custodials, is very conservatively charted (doing it the way I think it should be done gives a similar target of over $6,000) and assumes that gold would need to match the outstanding balances from other central banks being held by the Fed in "custody" for those banks in various US gov't instruments like bonds and agencies.


                        Originally posted by Finster
                        Sure it holds. You see the cycle go back and forth between actual assets and claims on assets:
                        Originally posted by Finster
                        IMO no one should be investing on the basis of expecting such an extreme, but in qualitative terms it is eminently reasonable to expect substantial movement in that direction.
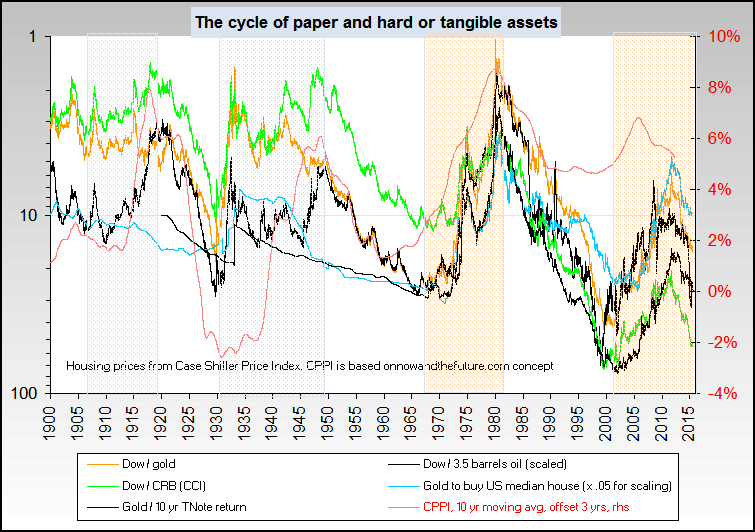
                        Well... not to pick a nit or anything... and to also note that log(gerhead) charts are useful sometimes and I'll lower myself enough to create one... ;) ... here's an even longer term view of the Dow and gold, plus various other similar relationships showing the shift back & forth over time between "paper" and "hard" assets.

                        The basic point here though is that the longer term picture is actually getting more volatile and it's not beyond the pale that gold could go to under 1:1 with the Dow.

                        Last edited by bart; March 05, 2007, 04:43 PM.
                        http://www.NowAndTheFuture.com

                        Comment


                        • #27
                          Re: 2/27/07--Beginning of a Bear Market?

                          interesting to speculate if gold stocks do as well as bullion in these cycles...I doubt it. But of course if you are a good stock picker you can get outsize returns on gold miners as opposed to bullion. Overall if you were to buy an index such as the $HUI and hold, would you outperform gold or is that a myth? I think towards the more advanced phases of this thing, all stocks will suffer...

                          Any thoughts?

                          And...one more thing. On your last chart, Bart, great stuff...notice how the recessions get rarer and rarer. And in terms of severity, although it's not on your chart, the last real recession I can remember is 1981. The early 1990s and the 2001 recession each were of diminishing severity.

                          I think this adds up to a pattern...but of what?

                          Comment


                          • #28
                            Re: 2/27/07--Beginning of a Bear Market?

                            Originally posted by bart
                            And here's another out there view of possible gold targets, based on relationships between two money numbers and some logic.

                            [chart]

                            The M1/gold line simply shows what gold could be prices at now if gold again is priced to match just the total amount of outstanding cash and checking account balances as it did in 1980. The other one, custodials, is very conservatively charted (doing it the way I think it should be done gives a similar target of over $6,000) and assumes that gold would need to match the outstanding balances from other central banks being held by the Fed in "custody" for those banks in various US gov't instruments like bonds and agencies.
                            Well that’s an eye-opener. I’m a little reticent to use the 1980 peak for an equivalent target. Partly because it’s such an extreme - perhaps due to the gold having been off-limits for ordinary investors so long - and partly because there is a very long term trend towards gold prices actually falling a bit short of stock prices. That very long term trend is denoted by the straight lines in the below chart. Nevertheless, it is very difficult to make a case that the stock/gold ratio will not be quite a bit higher in the coming years.

                            I think we’re on more solid ground with the stock/gold ratio than a specific dollar price. In the (admittedly unlikely) event that the CBs were to (belatedly) get serious about restraining inflation, the stock averages could go down (in dollar terms) more than gold rises. But your money growth analysis is especially interesting here because it is more directly germane to a gold/dollar ratio. Gold in dollar terms may struggle until Uncle Ben gets his helicopter loaded and in the air, but at that point all bets are off…

                            Originally posted by bart
                            Well... not to pick a nit or anything... and to also note that log(gerhead) charts are useful sometimes and I'll lower myself enough to create one... ;) ... here's an even longer term view of the Dow and gold, plus various other similar relationships showing the shift back & forth over time between "paper" and "hard" assets.

                            The basic point here though is that the longer term picture is actually getting more volatile and it's not beyond the pale that gold could go to under 1:1 with the Dow.

                            [chart]
                            There are fundamental reasons for gold to (as mentioned above) fall a little behind stocks in the very long term; mostly relating to the ability of technology to reduce the man-hours (real cost) required to mine each ounce of gold. On the other hand, as you point out, there also seems to be a trend towards increasing volatility, and the scale of the inflation we have just been through probably exceeds both what was experienced in twenties and sixties-seventies, which would augur for a correspondingly amplified reaction.

                            The above chart, BTW, differs in two ways from that which I posted earlier (and reproduced below) in that it is more of a close-up of putatively corresponding historical periods, and in that it focuses on the S&P (US market) as opposed to global markets. The below is broader in that it treats essentially the entire asset class of equities - globally - and it simply strings together in one continuous chart the whole history I have available.

                            Again, also note the overall rising trend of equity versus gold.

                            Finster
                            ...

                            Comment


                            • #29
                              Re: 2/27/07--Beginning of a Bear Market?

                              Originally posted by grapejelly
                              interesting to speculate if gold stocks do as well as bullion in these cycles...I doubt it. But of course if you are a good stock picker you can get outsize returns on gold miners as opposed to bullion. Overall if you were to buy an index such as the $HUI and hold, would you outperform gold or is that a myth? I think towards the more advanced phases of this thing, all stocks will suffer...

                              Any thoughts?

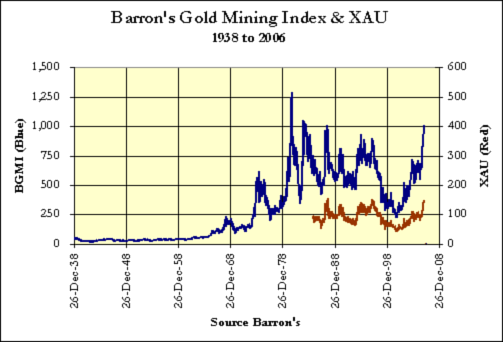
                              Very tough question as you know since there are so many variables on miners. There's little question that someone who is a great picker will outperform but those folk are *very* few and far between, but I think it's unlikely that the average index will outperform physical - i.e., it's a myth. The huge performing juniors aren't generally in the index, at least until they get big and well known.

                              The long term Barrons index shows it well (from sharelynx.com - great charts)(and Finster will have a moralgasm since it's a log chart ;)):


                              http://www.sharelynx.com/chartsfixed/Barrons/ADH.gif

                              Here's another that may be easier to read:


                              Originally posted by grapejelly
                              And...one more thing. On your last chart, Bart, great stuff...notice how the recessions get rarer and rarer. And in terms of severity, although it's not on your chart, the last real recession I can remember is 1981. The early 1990s and the 2001 recession each were of diminishing severity.

                              I think this adds up to a pattern...but of what?
                              Be a bit cautious on any recession conclusion. Not only has the definition of a recession changed over the years but when money is created at more rapid rates, recessions are fewer... in other words, central banks and "loose" money is the primary reason for the pattern change. There are lots of other factors, but in my opinion, it and inflation are by far the most important ones.
                              http://www.NowAndTheFuture.com

                              Comment


                              • #30
                                Re: 2/27/07--Beginning of a Bear Market?

                                Originally posted by Finster
                                Well that’s an eye-opener. I’m a little reticent to use the 1980 peak for an equivalent target. Partly because it’s such an extreme - perhaps due to the gold having been off-limits for ordinary investors so long - and partly because there is a very long term trend towards gold prices actually falling a bit short of stock prices. That very long term trend is denoted by the straight lines in the below chart. Nevertheless, it is very difficult to make a case that the stock/gold ratio will not be quite a bit higher in the coming years.
                                Nice nit-for-nit trade... ;) ... and I basically agree that the $6,000 target is at least as good as $2,000, $4,000 or $10,000. I actually hope that it peaks nearer the lower numbers, since the social and cultural impact that the higher numbers would represent are not exactly pretty.

                                By the way, I stole the custodials concept from Jim Sinclair - would that I were 1/10 as sharp as he is.


                                Originally posted by Finster
                                I think we’re on more solid ground with the stock/gold ratio than a specific dollar price. In the (admittedly unlikely) event that the CBs were to (belatedly) get serious about restraining inflation, the stock averages could go down (in dollar terms) more than gold rises. But your money growth analysis is especially interesting here because it is more directly germane to a gold/dollar ratio. Gold in dollar terms may struggle until Uncle Ben gets his helicopter loaded and in the air, but at that point all bets are off…
                                You got it and we agree as usual - the gold/dollar ratio is the final arbiter, especially in a free market. The main central bank was the one that got wise before things almost went pow in 1979-80, and Bernanke doesn't seem much like Volcker to me. *sigh*


                                Originally posted by Finster
                                There are fundamental reasons for gold to (as mentioned above) fall a little behind stocks in the very long term; mostly relating to the ability of technology to reduce the man-hours (real cost) required to mine each ounce of gold. On the other hand, as you point out, there also seems to be a trend towards increasing volatility, and the scale of the inflation we have just been through probably exceeds both what was experienced in twenties and sixties-seventies, which would augur for a correspondingly amplified reaction.

                                The above chart, BTW, differs in two ways from that which I posted earlier (and reproduced below) in that it is more of a close-up of putatively corresponding historical periods, and in that it focuses on the S&P (US market) as opposed to global markets. The below is broader in that it treats essentially the entire asset class of equities - globally - and it simply strings together in one continuous chart the whole history I have available.

                                Again, also note the overall rising trend of equity versus gold.

                                http://users.zoominternet.net/~fwuth...kGoldTrend.png

                                mmm... more nits... aka http://www.nowandfutures.com/grins/mmm_something.wav ;)

                                The biggest problem with comparing any non static stock or other index against gold over a long period is that it's not an apples to apples comparison. As I recall, there's only one or two stocks in today's Dow that were also in it during the '20s. There's also substitution bias and also dividends as well as shoddy Wall St. practices to take into account.

                                If I was able to vary the purity of gold the way that Dow Jones or Standard & Poors change their index content (and even after adding in dividends etc.), I believe gold would have outperformed substantially.

                                And I wouldn't even have to make it a log chart... ;)
                                http://www.NowAndTheFuture.com

                                Comment

                                Working...
                                X