 Tweet
Tweet
Economic Cliff Diving - By the Charts…
All told, a good read
The following charts, most of which come to you courtesy of the St. Louis Fed, paint a picture of the current economy that is very unstable at its base. Their “heroic efforts” to re-establish growth and inflation are simply not taking root as of yet.
Try as the Fed, the Treasury, and G20 might, as of yet they are simply peeing into the wind. The collapse of credit and wealth is simply happening much more quickly and powerfully than their reinflation efforts.
While you look out into the future and see that their actions are intended to be inflationary, keep in mind that timing is everything. We had an unprecedented period of inflation already, but we are now correcting the massive malinvestments that were created over years of abuse. Yes, the government actions are unprecedented in scale. They are attempting to reignite their ideal of nirvana which is never ending growth. As you know, if you’ve ever Spent Time with the Good Dr. Bartlett, never ending growth is mathematically IMPOSSIBLE.
In school we learn that curves generally come in the shape of a bell. In fact, in statistical analysis they teach a standard model that all you statistics students might remember is represented by the diagram below:
Nassim Taleb, author of The Black Swan contends that financial markets are too erratic to conform to this standard model. And he’s correct, but it’s not just the markets that don’t conform to a perfect bell shape distribution, ALMOST NOTHING DOES!
Waves in nature begin with slow and seemingly stable growth. The compounding math then begins to build into a more rapidly rising structure which eventually goes through a phase-transition to an exponential rise. The recent rise in corporate profits illustrates these phases very well:
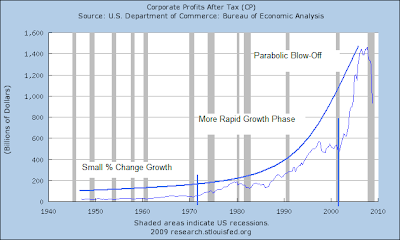
While the front side of the curve resembles the standard bell shape, exponential growth in nature does not usually result in a mirror image on the backside of the curve. What happens in nature, and in the marketplace, is that parabolic curves collapse on the backside and head virtually straight down. Witness the collapse of our markets during the Great Depression, the run up of the Nikkei index in Japan during the late 80’s and subsequent crash, our own Nasdaq in the year 2000, etc. The collapse happens much FASTER than the growth.
.
.
.
.
.
.
.
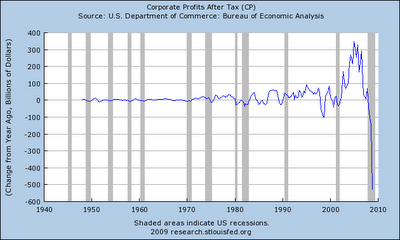
And here's a chart showing the amount of Decline in Corporate Profits year over year:
.
.
.
.
.
.
.
.
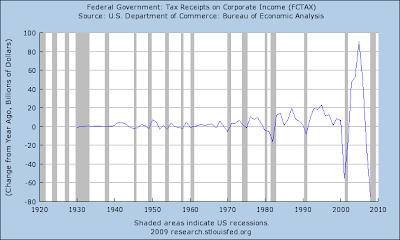
Here’s that chart showing the drop in Corporate Tax Receipts, by the way, it’s a U.S. Budget Disaster.
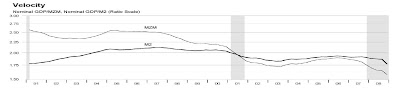
As the Fed attempts to force credit (debt) into the economy, they are finding that the velocity, or number of times money is exchanged, is falling to levels not seen since the Great Depression. A Velocity of 3 would be healthy, but what’s disturbing now is that the velocity of MZM, the broadest measure of money, is collapsing and is now just 1.6:
.
.
.
.
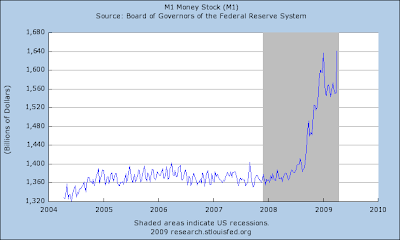
So, when you see charts like the M1 Money Stock and assume that all that cash is going to create inflation, you must keep it in context with the larger money supply picture and VELOCITY:
While there are all kinds of pretty formulas for money and velocity like M (V) = P (Q) (and many more that are much more complex), it’s really not that complex in the real world. The academics and their formulas often just miss the boat. The formula for velocity, for example doesn’t contain DEBT as one of the prime variables. While it may capture some of it indirectly, it doesn’t weigh it enough at the extremes, like we have now. Just take your own finances for example. If you have an extreme condition such as owing twice as much on credit card debt as you have income, then when you receive new money the odds are that the money received will not go into purchasing goods and services, it instead goes right back to the bank where it is used to pay interest on your debts and to discharge a minuscule amount of principle (lol, most likely).
Debt expands and grows the economy via leverage until it reaches a critical mass at which point it turns into a black hole and sucks the productive juices back from the economy.
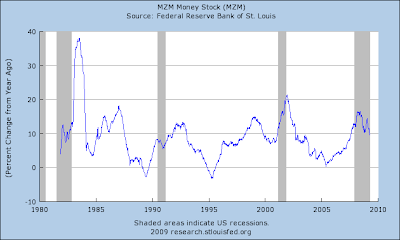
So, while the smaller measurements of money are zooming due to Fed pumping, the broader measurement of money, MZM, is also growing, but the rate of growth is falling slightly:
Yes, the strict definition of inflation is an increase in the money supply. BUT, there are variables that affect the outcome of inflation, such as its velocity. Another variable is the growth or contraction in population, or more correctly stated the size of the population in their peak earning and spending years.
.
.
.
.
.
.
.
Try as the Fed, the Treasury, and G20 might, as of yet they are simply peeing into the wind. The collapse of credit and wealth is simply happening much more quickly and powerfully than their reinflation efforts.
While you look out into the future and see that their actions are intended to be inflationary, keep in mind that timing is everything. We had an unprecedented period of inflation already, but we are now correcting the massive malinvestments that were created over years of abuse. Yes, the government actions are unprecedented in scale. They are attempting to reignite their ideal of nirvana which is never ending growth. As you know, if you’ve ever Spent Time with the Good Dr. Bartlett, never ending growth is mathematically IMPOSSIBLE.
In school we learn that curves generally come in the shape of a bell. In fact, in statistical analysis they teach a standard model that all you statistics students might remember is represented by the diagram below:

Nassim Taleb, author of The Black Swan contends that financial markets are too erratic to conform to this standard model. And he’s correct, but it’s not just the markets that don’t conform to a perfect bell shape distribution, ALMOST NOTHING DOES!
Waves in nature begin with slow and seemingly stable growth. The compounding math then begins to build into a more rapidly rising structure which eventually goes through a phase-transition to an exponential rise. The recent rise in corporate profits illustrates these phases very well:

While the front side of the curve resembles the standard bell shape, exponential growth in nature does not usually result in a mirror image on the backside of the curve. What happens in nature, and in the marketplace, is that parabolic curves collapse on the backside and head virtually straight down. Witness the collapse of our markets during the Great Depression, the run up of the Nikkei index in Japan during the late 80’s and subsequent crash, our own Nasdaq in the year 2000, etc. The collapse happens much FASTER than the growth.
.
.
.
.
.
.
.
And here's a chart showing the amount of Decline in Corporate Profits year over year:
.
.
.
.
.
.
.
.
Here’s that chart showing the drop in Corporate Tax Receipts, by the way, it’s a U.S. Budget Disaster.

As the Fed attempts to force credit (debt) into the economy, they are finding that the velocity, or number of times money is exchanged, is falling to levels not seen since the Great Depression. A Velocity of 3 would be healthy, but what’s disturbing now is that the velocity of MZM, the broadest measure of money, is collapsing and is now just 1.6:

.
.
.
.
So, when you see charts like the M1 Money Stock and assume that all that cash is going to create inflation, you must keep it in context with the larger money supply picture and VELOCITY:

While there are all kinds of pretty formulas for money and velocity like M (V) = P (Q) (and many more that are much more complex), it’s really not that complex in the real world. The academics and their formulas often just miss the boat. The formula for velocity, for example doesn’t contain DEBT as one of the prime variables. While it may capture some of it indirectly, it doesn’t weigh it enough at the extremes, like we have now. Just take your own finances for example. If you have an extreme condition such as owing twice as much on credit card debt as you have income, then when you receive new money the odds are that the money received will not go into purchasing goods and services, it instead goes right back to the bank where it is used to pay interest on your debts and to discharge a minuscule amount of principle (lol, most likely).
Debt expands and grows the economy via leverage until it reaches a critical mass at which point it turns into a black hole and sucks the productive juices back from the economy.
So, while the smaller measurements of money are zooming due to Fed pumping, the broader measurement of money, MZM, is also growing, but the rate of growth is falling slightly:

Yes, the strict definition of inflation is an increase in the money supply. BUT, there are variables that affect the outcome of inflation, such as its velocity. Another variable is the growth or contraction in population, or more correctly stated the size of the population in their peak earning and spending years.
.
.
.
.
.
.
.
Comment