 Tweet
Tweet
Here is the chart I made over the new bubble coming a few weeks ago. It's meant to debunk the deflation myth.
The currency cross I have showed is an excellent measure of global liquidity conditions.
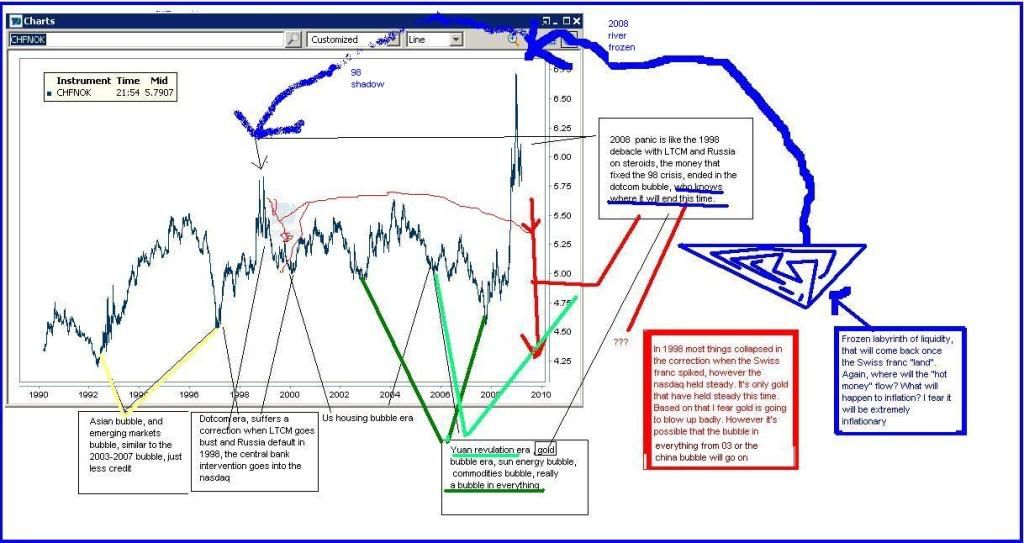
Alternative 1: This is the big one, and things just go like 1929.
Alternative 2: It blows up like after 1998. Who knows in what. Probably the more general bubble, with emerging markets, weak dollar, alternative energy, oil, commodities.
The CHF have weakened a lot , almost 10 % , since I made this chart, the dollar and yen have to, so liquidity conditions are greatly improving, so far. A sign the bubble is on the way.
The currency cross I have showed is an excellent measure of global liquidity conditions.
Alternative 1: This is the big one, and things just go like 1929.
Alternative 2: It blows up like after 1998. Who knows in what. Probably the more general bubble, with emerging markets, weak dollar, alternative energy, oil, commodities.
The CHF have weakened a lot , almost 10 % , since I made this chart, the dollar and yen have to, so liquidity conditions are greatly improving, so far. A sign the bubble is on the way.