Announcement

Collapse
No announcement yet.

Inflation and Deflation, a chart

Collapse
X
 
  • Filter
  • Time
  • Show
Clear All
new posts

  • Inflation and Deflation, a chart

    I was reviewing a chart on John William's shadowstats site:

    http://www.shadowstats.com/cgi-bin/sgs/data

    Many people in these forums suggest that inflation is the greater threat, which follows a breif period of disinflation or outright deflation. But this chart shows M1 (cash, etc) dropping alot with M3 (all measures of money) blowing up... they are diverging, at the same time!

    My question is, how can M1 be deflationary while M3 is inflationary?

    -436
  • #2
    Re: Inflation and Deflation, a chart

    I try my best to avoid charts that have no basis in reality. Why would you believe M3 to be growing at all? What tests do you perform on their number to double check their figures? I'd be asking where is all this d0llar creation coming from? Why would anyone believe this chart? Who owns this shadow site?

    Have we declared war on anyone else? Nope. Do I need more money or less money to purchase a home? Are auto sales up or down? Is there a new social program the government is talking about financing? Is business booming? I don't see the expansion of credit this chart is saying is taking place, so not knowing who finances the information I see no reason to believe it to be true.
    "Men, it has been well said, think in herds; it will be seen that they go mad in herds, while they only recover their senses slowly, and one by one."
    - Charles Mackay

    Comment


    • #3
      Re: Inflation and Deflation, a chart

      Originally posted by fourthirtysix
      I was reviewing a chart on John William's shadowstats site:

      http://www.shadowstats.com/cgi-bin/sgs/data

      Many people in these forums suggest that inflation is the greater threat, which follows a breif period of disinflation or outright deflation. But this chart shows M1 (cash, etc) dropping alot with M3 (all measures of money) blowing up... they are diverging, at the same time!

      My question is, how can M1 be deflationary while M3 is inflationary?

      -436
      m3 is m1 plus more components. if those extras rise enough, m3 can grow while m1 shrinks. look under "money measures" at bart's web site at:
      http://www.nowandfutures.com/glossary.html#M
      you might also want to look at bart's attempt to model m3 since it is no longer officially reported.
      what's growing is credit more than what we usually think of as "money." as for evidence of its growth, look at equity markets, private equity, corporate cash balances. there's no lack of money or credit: that's what is keeping the markets afloat.

      Comment


      • #4
        Re: Inflation and Deflation, a chart

        Originally posted by Tet
        I try my best to avoid charts that have no basis in reality. Why would you believe M3 to be growing at all? What tests do you perform on their number to double check their figures? I'd be asking where is all this d0llar creation coming from? Why would anyone believe this chart? Who owns this shadow site?

        Have we declared war on anyone else? Nope. Do I need more money or less money to purchase a home? Are auto sales up or down? Is there a new social program the government is talking about financing? Is business booming? I don't see the expansion of credit this chart is saying is taking place, so not knowing who finances the information I see no reason to believe it to be true.
        While I agree on your general point about charts and checking one's sources, the rest is very much open to opinion at least.

        ShadowStats is owned by John Williams and he's an econometrician that has been around for decades, with his services being bought by many large & small corporations and individuals.

        I could also state "Why would you believe M3 to *not* be growing at all?", etc.

        There are many factors of which you may not be aware, not the least of which is the concept that there is a significant lag between the time that money is "created" and it impacts the economy. I state this due to your comment about housing and energy prices, etc. And just because you don't see the credit and money creation that he or other sites show does not mean that it is not occurring.


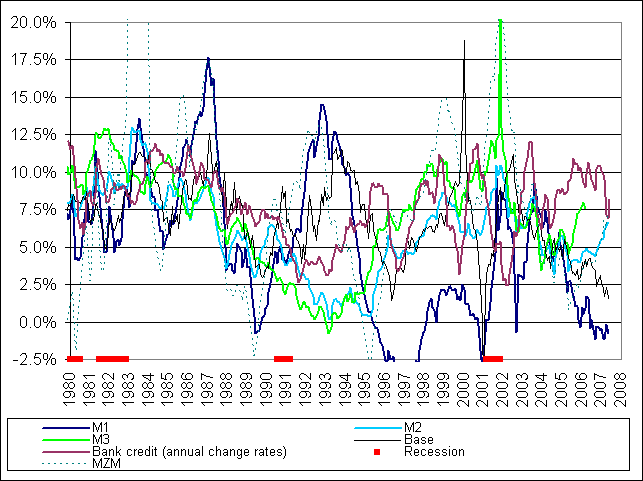
        On the M1 and M3 initial post, the two are not terribly well correlated. Here's a picture of the last 25+ years:


        The source is the Fed's FRED database.
        http://www.NowAndTheFuture.com

        Comment


        • #5
          Re: Inflation and Deflation, Another Chart

          Last edited by Finster; January 06, 2007, 04:07 PM.
          Finster
          ...

          Comment


          • #6
            Re: Inflation and Deflation, a chart

            Nice chart, Finster.
            Jim 69 y/o

            "...Texans...the lowest form of white man there is." Robert Duvall, as Al Sieber, in "Geronimo." (see "Location" for examples.)

            Dedicated to the idea that all people deserve a chance for a healthy productive life. B&M Gates Fdn.

            Good judgement comes from experience; experience comes from bad judgement. Unknown.

            Comment


            • #7
              Re: Inflation and Deflation, a chart

              Originally posted by Jim Nickerson
              Nice chart, Finster.
              I should have put a big, fat question mark on the right at the very end of the line ...
              Finster
              ...

              Comment

              Working...
              X