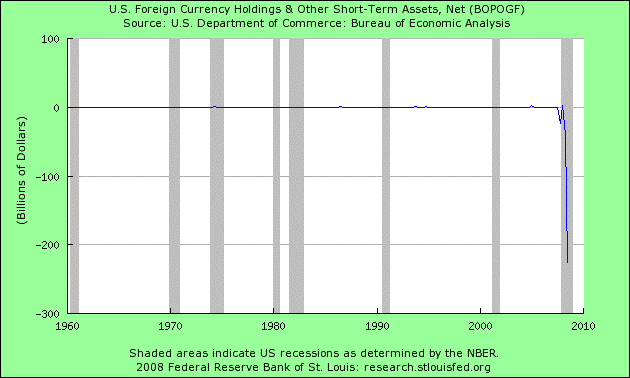
Fred's chart originally was posted to Mega's "China Moves a Move" 12/25 post. After reviewing the source report, linked below, and finding what appears to be the "offset," I thought it worth some additional discussion.
Quote:
See the BEA report, issued Dec 17th, Tables on Page 7, Here.
U.S. Foreign Currency & Short-Term Assets, line 49, shows large Increases/ Financial OUTflows (cumulative 2008: $264 bn). It's a component of Line 45: US Government Assets Owned Abroad.
If you skip down a few lines to Line 54, U.S. Claims Reported by U.S. Banks, (BOPOPO Chart below) these categories show huge INflows in the same quarters this year.
Is this evidence of the Fed/Treasury buying foreign assets owned by U.S. Banks? Another form of stealth capitalization/nationalization?


Quote:
Originally Posted by FRED  Meanwhile, back in the USA:  |
See the BEA report, issued Dec 17th, Tables on Page 7, Here.
U.S. Foreign Currency & Short-Term Assets, line 49, shows large Increases/ Financial OUTflows (cumulative 2008: $264 bn). It's a component of Line 45: US Government Assets Owned Abroad.
If you skip down a few lines to Line 54, U.S. Claims Reported by U.S. Banks, (BOPOPO Chart below) these categories show huge INflows in the same quarters this year.
Is this evidence of the Fed/Treasury buying foreign assets owned by U.S. Banks? Another form of stealth capitalization/nationalization?

