Announcement

Collapse
No announcement yet.

This article made me think of Bart and run for my tinfoil

Collapse
X
 
  • Filter
  • Time
  • Show
Clear All
new posts

  • This article made me think of Bart and run for my tinfoil

    Retail sales in the U.S. dropped in October by the most on record, pushing the economy toward the worst slump in decades. The 2.8 percent decrease was the fourth consecutive drop and the biggest since records began in 1992, the Commerce Department said today...
    Not since the last century!!!

    The economic slump will intensify this quarter and persist into the first three months of 2009, making it the longest downturn since 1974-75, economists forecast...
    1974 - Back before records were kept...these guys are good!

    http://www.bloomberg.com/apps/news?p...2UE&refer=home

    No wonder the tin foil hat is required. We have people writing for Bloomberg who tell their readers that retail sales have only been tracked since 1992. The truth is much more subtle and way more sinister. Tinfoil on sir, but it's melting...what now?
    Last edited by santafe2; November 15, 2008, 03:56 PM. Reason: too much fun not too

  • #2
    Re: This article made me think of Bart and run for my tinfoil

    Somebody at Bloomberg was sloppy

    The current series with some modifications in methodology does begin in 1992. However, the monthly retail sales data goes back to Oct 1953. I believe prior to that the data exists as an annual series, but not a monthly series.

    Comment


    • #3
      Re: This article made me think of Bart and run for my tinfoil

      Originally posted by santafe2 View Post
      Not since the last century!!!


      1974 - Back before records were kept...these guys are good!

      http://www.bloomberg.com/apps/news?p...2UE&refer=home

      No wonder the tin foil hat is required. We have people writing for Bloomberg who tell their readers that retail sales have only been tracked since 1992. The truth is much more subtle and way more sinister. Tinfoil on sir, but it's melting...what now?
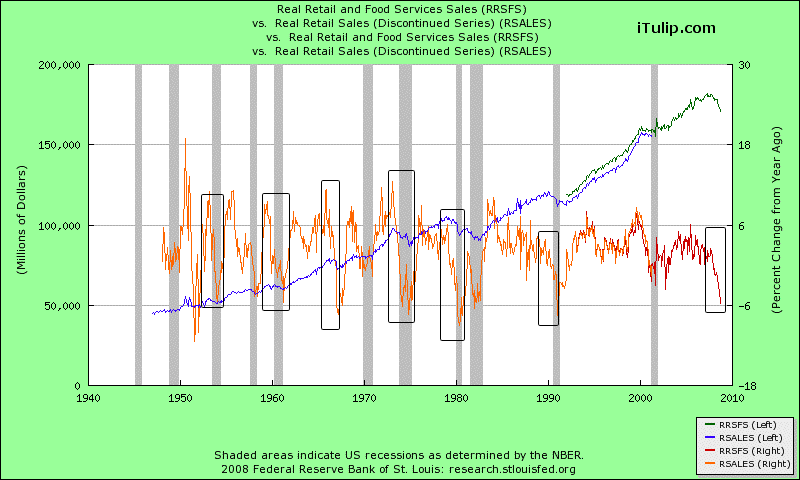
      Doesn't take a brain surgeon to notice that the Commerce Department's old RSALES, Real Retail Sales (Discontinued Series), Monthly, Millions of Dollars, Seasonally Adjusted series that ran from 01-01-47 to 2001-04-01 is more or less the same as the newer RRSFS Real Real Retail and Food Services Sales, Monthly, Millions of Dollars, Seasonally Adjusted series that started 1992-01-01. Since 1992 they have tracked closely.

      Base on this, so far the retail data show a retail sales decline y-o-y change much like most recessions since 1947. We expect that the anecdotal stories of more severe declines will start to show up in Q1 and Q2 2009.


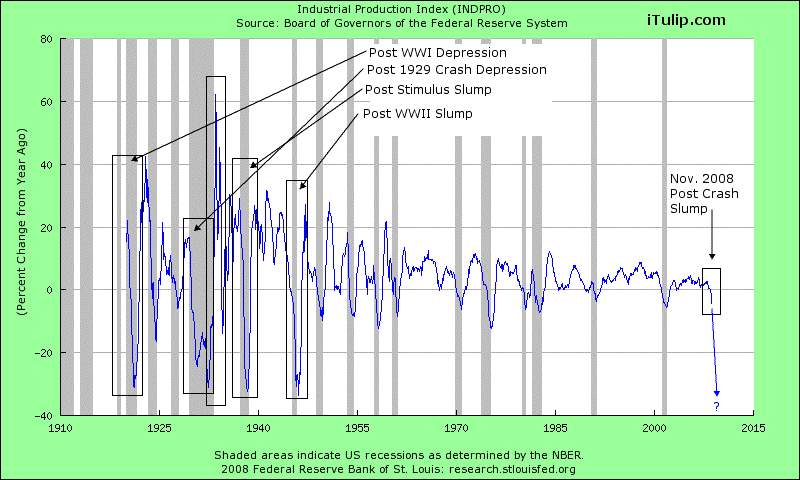
      Compared to the post WWI depression, the post 1929 crash depression, the years between 1938 and WWII when the government took its fiscal spending pedal off the gas, and the post WWII slump, declines in production are tame.


      Then again, the US doesn't produce as much now as then, so maybe we're looking at the wrong data for comparison.


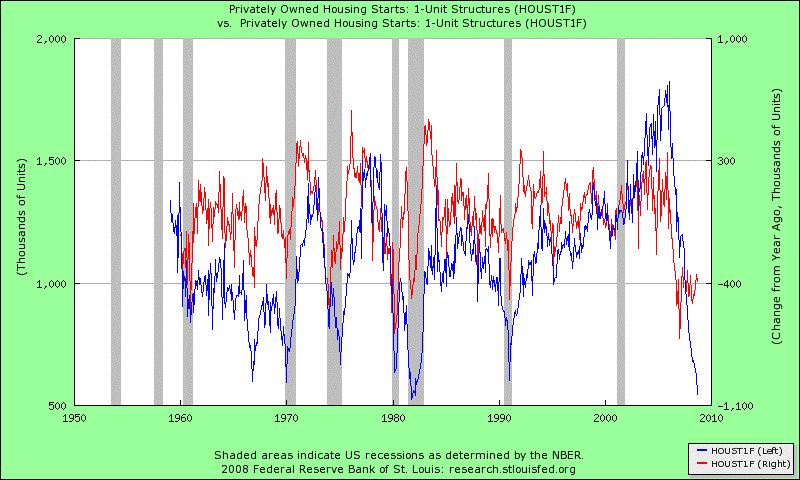
      Today we "manufacture" houses, and there the picture is more clear, and more closely relates to the gruesome retail crash stories we are hearing. Likely the retail data will follow in time.
      Ed.

      Comment


      • #4
        Re: This article made me think of Bart and run for my tinfoil

        You always have to look beyond the headline #s.

        The drop in retail sales was caused by a drop in gas purchases which was caused by the quick plummet in fuel prices.


        "Take out cars and gas, it's a drop of half a percent. It's not good, but it's not horrific. This could have been worse; it's encouraging that it wasn't," said David Resler, chief economist at Nomura Securities in New York.


        Nothing to see here..


        The spike in unemployment claims was much worse.

        Comment


        • #5
          Re: This article made me think of Bart and run for my tinfoil

          Originally posted by blazespinnaker View Post
          You always have to look beyond the headline #s.

          The drop in retail sales was caused by a drop in gas purchases which was caused by the quick plummet in fuel prices.


          "Take out cars and gas, it's a drop of half a percent. It's not good, but it's not horrific. This could have been worse; it's encouraging that it wasn't," said David Resler, chief economist at Nomura Securities in New York.


          Nothing to see here..


          The spike in unemployment claims was much worse.
          I was just having fun with this story as it was so poorly written...but you're quoting from it like it's serious? Of course there's nothing here, that was the point. Put your tinfoil hat on and have some fun once in a while, it's allowed here.

          By the way, if it starts melting, call Bart. I've no expertise in this area.

          Comment


          • #6
            Re: This article made me think of Bart and run for my tinfoil

            Originally posted by santafe2 View Post
            Tinfoil on sir, but it's melting...what now?
            You must not have downloaded and installed either the extra layers kit (including optional silver layers) or the polishing kit to help reflect even more of the dangerous vibrations... :rolleyes:


            And for some redeeming social value for this post, an update to my long term retail sales chart showing nominal sales, CPI adjusted sales and CPI w/o lies adjusted sales.

            http://www.NowAndTheFuture.com

            Comment


            • #7
              Re: This article made me think of Bart and run for my tinfoil

              Originally posted by bart View Post
              You must not have downloaded and installed either the extra layers kit (including optional silver layers) or the polishing kit to help reflect even more of the dangerous vibrations... :rolleyes:


              And for some redeeming social value for this post, an update to my long term retail sales chart showing nominal sales, CPI adjusted sales and CPI w/o lies adjusted sales.

              Bart, are you saying we're overstating US consumption by a factor of almost 2? That clearly has implications well beyond anything I've taken away from your previous posts. Have you tested other base years?

              Comment


              • #8
                Re: This article made me think of Bart and run for my tinfoil

                SantaFe,
                What Bart has been stating, I have stated elsewhere in another thread, and that gives you the flavour of the poison that inflation really is! Do checkout all the links there.

                Comment


                • #9
                  Re: This article made me think of Bart and run for my tinfoil

                  Originally posted by Rajiv View Post
                  SantaFe,
                  What Bart has been stating, I have stated elsewhere in another thread, and that gives you the flavour of the poison that inflation really is! Do checkout all the links there.
                  Thanks Rajiv. I'm familiar with Shadowstats but I don't take their numbers as truth, just one point of view. I'm still hoping to hear from Bart regarding his CPI chart. The convergence in 2001 and the explosive divergence after that can have more than one explanation. I'd like a pointer to this if he's already made it or a clear explanation on this thread.

                  I'm not challenging it, one can't challenge a graph. I just don't understand the underlying logic and I'd like to.

                  Comment


                  • #10
                    Re: This article made me think of Bart and run for my tinfoil

                    Originally posted by santafe2 View Post
                    Bart, are you saying we're overstating US consumption by a factor of almost 2? That clearly has implications well beyond anything I've taken away from your previous posts. Have you tested other base years?
                    On a "real" basis and assuming you accept John Williams full CPI corrections, yes. The algorithm used is the same one I use for all the inflation corrected charts.
                    Even just using CPI-U alone shows about a 30% over stating. The raw CPI-U index in 1/2000 was about 169 and now its about 217.

                    As far as other base years, here's the same chart as a one-off, but based in 1982 when the shadowstats.com corrections started.


                    http://www.NowAndTheFuture.com

                    Comment


                    • #11
                      Re: This article made me think of Bart and run for my tinfoil

                      Originally posted by bart View Post
                      On a "real" basis and assuming you accept John Williams full CPI corrections, yes. The algorithm used is the same one I use for all the inflation corrected charts.
                      Even just using CPI-U alone shows about a 30% over stating. The raw CPI-U index in 1/2000 was about 169 and now its about 217.

                      As far as other base years, here's the same chart as a one-off, but based in 1982 when the shadowstats.com corrections started.


                      Thanks Bart but I feel like I'm less clear than I was before. Have you laid out a clear primer to this POV? If so, I'd like to read it.

                      Comment

                      Working...
                      X