Announcement

Collapse
No announcement yet.

Bearish Information

Collapse
X
 
  • Filter
  • Time
  • Show
Clear All
new posts

  • Re: Bearish Information

    Originally posted by Jim Nickerson View Post
    Thank you, bart, for your opinion.

    It seems a fact that here someone is always referencing some value as "real" when adjusted by some other factor. "Real interest rates" and then one gets into whether to use BLS lies, shadowstats.com's numbers, or
    BLS+lies to suggest what may be "real."

    Then talking about gold's 1980's peak being no where near what would represent an inflation adjusted peak.

    And then there is income and inflation-adjusted income, ad infinitum.

    There seems no end to discussion and considerations between what is real and what is not.

    I obviously don't know the answer.

    Holy-moly! Look at the $VIX's behavior vs. the $SPX when both are adjusted by the $USD--US dollar index.

    What does this all mean? Rhetorical question.

    http://stockcharts.com/h-sc/ui?s=$VI...d=p99939916006

    You're welcome Jim.

    I agree on all the real vs. unreal issues... and also think that its a sign of the times and general decline in "marketing" and "spin" and "PR" truths. And it didn't start recently either... I imagine you remember the Wonder Bread "Build strong bodies 12 ways" slogan. *sigh*

    Ideally, we all want the most accurate data we can find on which to base our investing & trading decisions and since none of us can even hope to have 100% true facts and data, its inevitable that there are differences of opinion.

    But even Mish believes that CPI is severely understated, and thank goodness that its beginning to be fully realized by many US citizens. Only then do we have a chance of a snowball in hell of actual reform etc.... and, much more importantly, a real and broad understanding of what the real cause of inflation is.
    http://www.NowAndTheFuture.com

    Comment


    • Re: Bearish Information Re. Mike Burk

      7/12/08 Technical Market Report by Mike Burk

      Originally posted by Mike Burk
      The good news is:
      • The conditions are ripe for a washout which would be a setup for a tradable rally.
      .
      .
      The two charts below show short term indicators that have catastrophically failed over the past week or two. Looking at these indicators you would think we had a big rally last week and are likely to decline next week.
      .
      .
      By all measures the coming week has been one of the worst of the year.
      .
      .
      Conclusion

      Predicting crashes or washouts is a loser's game because there are so few examples to draw on for comparison. The market is already at oversold extremes, money supply is not growing and seasonally next week has been one of the worst weeks of the year. Give me a washout.

      I expect the major indices to be lower on Friday July 17 than they were on Friday July 11.
      Jim 69 y/o

      "...Texans...the lowest form of white man there is." Robert Duvall, as Al Sieber, in "Geronimo." (see "Location" for examples.)

      Dedicated to the idea that all people deserve a chance for a healthy productive life. B&M Gates Fdn.

      Good judgement comes from experience; experience comes from bad judgement. Unknown.

      Comment


      • Re: Bearish Information Re. Euro fair value $1.30

        There are all sorts of predictions in this article about where the Euro will be by end of Q308 and year end, etc. Below are the highlights.

        http://www.bloomberg.com/apps/news?p...yso&refer=home

        Gross Likes Dollar More Than Euro for 1st Time on EU (Update1) 7/14/2008
        • The euro is 30 percent overvalued versus the dollar, based on purchasing power parity, according to Newport Beach, California-based Pimco. That's more than any other currency among the Group of 10 richest nations. Purchasing power parity accounts for differences in the exchange rates of national currencies.
        • ``We're not far off the capitulation point for the euro,'' said Mitul Kotecha, head of foreign-exchange research in London at Calyon, the investment-banking unit of Credit Agricole SA, France's second-biggest bank. The euro will fall to $1.52 by the end of the third quarter and to $1.45 by April 2009, he said.
        • It may be too soon to bet against the euro because the U.S. economy is also slowing, according to Derek Halpenny, head of currency research in London at Bank of Tokyo-Mitsubishi UFJ Ltd., a unit of Japan's largest bank by market value. The euro will rise to $1.62 by the end of the third quarter, before falling back to $1.58 in the final three months of the year, he said.
        • The euro will slide to $1.50 by the end of the third quarter and $1.45 by year-end, he said. Redeker is more bearish than most strategists. The common European currency will weaken 5.7 percent to $1.50 by year-end, and slip to $1.45 by mid-2009, according to the median of 37 analysts surveyed by Bloomberg.
        • ``At current levels the euro is an awfully expensive currency,'' said Stephen Jen, chief currency strategist at Morgan Stanley in London and a former Fed economist. ``We see fair value for the currency at around $1.30.''
        Jim 69 y/o

        "...Texans...the lowest form of white man there is." Robert Duvall, as Al Sieber, in "Geronimo." (see "Location" for examples.)

        Dedicated to the idea that all people deserve a chance for a healthy productive life. B&M Gates Fdn.

        Good judgement comes from experience; experience comes from bad judgement. Unknown.

        Comment


        • Re: Bearish Information Re. Persistent gold bullishness.

          http://www.marketwatch.com/news/stor...507A99E0DC2%7D

          Timers' optimism may bode ill for goldCommentary: They don't seem to be worried; that's a bad sign to contrarians

          By Mark Hulbert, MarketWatch Last update: 9:46 p.m. EDT July 29, 2008

          Gold bullion had a bad day on Tuesday, with the nearby futures contract dropping $11.40 an ounce to close at $926.40.


          Yet not one of the editors of the short-term gold-timing newsletters tracked by the Hulbert Financial Digest reacted by reducing his recommended exposure to the gold market.

          Therein lies a tale, and its conclusion does not bode well for gold bullion's immediate prospects.

          Usually, according to contrarian analysis, advisers become more bullish as the market rises and more pessimistic as the market falls. It's indicative of stubbornly held beliefs when an adviser resists this typical pattern, and when such stubbornly-held beliefs are widely shared, they often prove to be wrong.

          That would appear to be what's shaping up now.

          Consider the latest readings of the Hulbert Gold Newsletter Sentiment Index (HGNSI), which represents the average recommended gold market exposure among a subset of short-term gold timing newsletters tracked by the Hulbert Financial Digest. As of Tuesday night, the HGNSI stood at 41.1%, unchanged on the day.
          .
          .
          To appreciate just how modest a drop that is, consider where the HGNSI stood in mid-April, when gold bullion was trading at the same level it is today. The HGNSI then stood at minus 10.7%, which meant that the editor of the average gold-timing newsletter was recommending his clients allocate 10.7% of their gold portfolios to shorting the market.

          The difference between today's HGNSI level of 41.1% and that mid-April level of minus 10.7% -- nearly 52 percentage points -- is a good indicator of how much more optimistic the typical gold timer is today.

          To be sure, sentiment is not the only thing that makes the investment world go round; contrarian analysis should be no more than just one tool in the gold trader's tool chest.

          That said, contrarians would be more optimistic about gold's short-term prospects if there weren't so many gold timers who have remained stubbornly bullish in the face of gold's recent decline.


          Jim 69 y/o

          "...Texans...the lowest form of white man there is." Robert Duvall, as Al Sieber, in "Geronimo." (see "Location" for examples.)

          Dedicated to the idea that all people deserve a chance for a healthy productive life. B&M Gates Fdn.

          Good judgement comes from experience; experience comes from bad judgement. Unknown.

          Comment


          • Re: Bearish Information Re. 300 POINT MOVES IN DJI

            Here is an interesting analysis regarding when 300 point daily moves occur in the DJI. I can't immediately think of how to use it aS A "timing device" pertinent to suggesting any end to the current bear market, but as long as these major one-day moves continue to occur (two have occurred since the article was prepared: +331.62 on 8/5/2008 and +302.89 on 8/8/2008) if history holds, then the overall orientation should be that we continue in an equity bear market.


            David Rosenberg (Merrill Lynch): Up-days of 300 points are typical of bear markets
            “The Dow surged 331 points – moves like that typically take place in bear markets. There have been six of these sessions since the bear market began a year ago; there were absolutely none in the 2002-07 bull market. Keep in mind that there have been 10 days this down-cycle when the Dow closed down 300 points or more. In other words, volatility gains momentum in bear markets.

            “Go back to the 2000-02 bear market and you will see much the same thing – there were actually nearly twice as many 300 up-days in that down-phase as there were 300-point losses! And this was in the context of a 38% peak-to trough decline in the DJIA. So, think of what happened yesterday as a characteristic of a bear market, even if the shorts got painfully squeezed – that should not be lost on investors as we go through this oversold technical rally (that has seen the financials soar 30% from the mid-July lows).”

            Source: David Rosenberg, Merrill Lynch, August 6, 2008.

            I have noted earlier somewhere here on iTulip I rode the 2000-2002 bear market all the way down with a "buy-and-hold" mentality + I guess just overt stupidity.

            I have continued to attempt to understand my motivations in having done that, and I expect, as I have noted before, it was these 12 up days during the down trend that kept me invested long. I can remember days my portfolio gained 100K, and the worst down days were usually less that the best up days.

            If I were still long a lot of stocks from the top last fall in the current down trend, which I am not, I conjecture that the markets might be nearer a bottom (how near, who knows?) and though one mostly long would have had a lot of pain, it might be that things could turn up in the next few months--purely opinion on my part. I'm glad this time I did not stay long.
            Last edited by Jim Nickerson; August 10, 2008, 11:39 AM.
            Jim 69 y/o

            "...Texans...the lowest form of white man there is." Robert Duvall, as Al Sieber, in "Geronimo." (see "Location" for examples.)

            Dedicated to the idea that all people deserve a chance for a healthy productive life. B&M Gates Fdn.

            Good judgement comes from experience; experience comes from bad judgement. Unknown.

            Comment


            • Re: Bearish Information Re. Hulbert on Gold

              http://www.marketwatch.com/news/stor...BC7681B5828%7D

              How low can you go? Commentary: Some gold timers still haven't thrown in the towel, a bad sign By Mark Hulbert, MarketWatch Last update: 6:32 p.m. EDT Aug. 11, 2008

              Originally posted by Hulbert
              ANNANDALE, Va. (MarketWatch) -- The big market mover on Monday was gold, dropping by more than 4% during the day alone.


              Gold bullion (38099902) is now posting a loss for the year to date. Read full story

              Contrarians were not surprised by the recent weakness, as it has been apparent to them for several weeks now that gold timers were too optimistic, providing a textbook illustration of the notion that bear markets like to decline a slope of hope. See July 29 column See Aug. 6 column for Barron's Online

              Unfortunately for the gold bulls, it's not clear that enough gold timers have thrown in the towel to convince contrarians that a bottom is at hand.

              Consider where the Hulbert Gold Newsletter Sentiment Index (HGNSI) stands. It reflects the average recommended gold market exposure among a subset of short-term gold timing newsletters tracked by the Hulbert Financial Digest. As of Monday night, the HGNSI stood at 5.4%, meaning that the average gold timing newsletter is recommending that clients invest 5.4% of their gold portfolios in gold and gold-related investments.

              The good news, from a contrarian point of view: This 5.4% is a lot lower than the 64.3% level to which the HGNSI soared in early and mid July. The bad news is that it is not even lower.

              For example, the HGNSI dropped to minus 10.7% in the correction that ended in early May, or 16.1 percentage points lower than where it stands today. Even so, gold then bottomed out at above the $850/ounce level, some $25 per ounce higher than where it stands today. That difference betrays now much more inclined the average gold timer is today to see the glass has half full rather than half empty.

              Another comparison that leads to the same conclusion: During gold-market weakness in early April, the HGNSI dropped to as low as minus 17.9%, or more than 23 percentage points lower than where it stands today. Even so, bullion at that time was trading above $900 per ounce, or some $80 per ounce higher than where it closed Monday.

              All of this suggests to contrarians that more gold weakness is in store.

              What would lead contrarians to conclude that a bottom was finally at hand? Coming up with a single answer is difficult, since different contrarians have different thresholds that would trigger a buy signal. But, at a minimum, the HGNSI will probably need to drop into negative territory. That's because virtually every intermediate bottom in the gold market in recent years was accompanied by HGNSI levels below zero.

              It's impossible to predict when that might happen. It might be, for example, that a couple more days of weakness will lead to capitulation on the part of the typical gold timing newsletter editor. But it also could be that a dead-cat bounce in the gold market leads to renewed hope on the part of the average gold timer, thereby postponing that bottom.

              In any case, we're not there yet.

              Jim 69 y/o

              "...Texans...the lowest form of white man there is." Robert Duvall, as Al Sieber, in "Geronimo." (see "Location" for examples.)

              Dedicated to the idea that all people deserve a chance for a healthy productive life. B&M Gates Fdn.

              Good judgement comes from experience; experience comes from bad judgement. Unknown.

              Comment


              • Re: Bearish Information Re. Aden sisters, possibly bearish gold.

                http://www.marketwatch.com/news/stor...CD072232161%7D

                Originally posted by Brimelow on Aden Sisters
                You can actually see this process of trend-testing underway in the Adens' discussion of gold: "As we write, for one of the first times in seven years, gold is seriously testing its major trend. It's slipping below its key 65-week moving average at $819. The only other two times this temporarily happened was in 2004 and 2005. This is now important to watch because if December gold stays clearly below $819 this week, the major trend will turn bearish for the first time since 2001. This is an alert!

                "Keep in mind, our maximum downside target ... has been the 65-week moving average. Based on timing, August is also a normal time for a [low]. Plus, considering the oversold nature in most metals and shares, it looks like the worst is at hand, rather than this being the start of a bear market."

                But they add: "Nevertheless, we have to be cautious. This may be a great buying opportunity but we also have to be prepared to make a change if that's what the market tells us."


                Right now, the Adens recommend sticking with their recommended investment allocation:
                • 40% Gold & silver physical & ETFs, and gold & silver shares
                • 30% Energy and resource stocks
                • 30% Cash: Euro, Swiss franc, Singapore and Australian dollars, U.S. dollar or currency funds
                Here's $GOLD through tonight. http://stockcharts.com/h-sc/ui?s=$GO...100&a=85010109

                325 DMA is at 815.42, and as I write Kitco spot is 792.60.

                EdiT: Next day, 8/15/08. $GOLD today was down 22.40 to 792.10 and there is now clear penetration of the 325 DMA. nOTE THAT THE CHART LINKED ABOVE IF CLICKED 3 MONTHS FROM NOW WOULD SHOW A CHART UPDATED TO THAT DATE AND THE ABOVE FIGURES WOUL NO LONGER BE APPARENT.
                Last edited by Jim Nickerson; August 15, 2008, 10:51 PM.
                Jim 69 y/o

                "...Texans...the lowest form of white man there is." Robert Duvall, as Al Sieber, in "Geronimo." (see "Location" for examples.)

                Dedicated to the idea that all people deserve a chance for a healthy productive life. B&M Gates Fdn.

                Good judgement comes from experience; experience comes from bad judgement. Unknown.

                Comment


                • Re: Bearish Information Re. Swenlin

                  Originally posted by Swenlin
                  Ascending Wedge Implies Correction Imminent
                  by Carl Swenlin
                  August 15, 2008
                  The rally that began off the July lows has not demonstrated the kind of strength we normally expect from the deeply oversold conditions that were present at its beginning. Instead, the meager price advance has served only relieve oversold compression and advance internal indicators to moderately overbought levels. In the process, as the chart shows, the price pattern has morphed into an ascending wedge formation, a bearish formation that usually breaks to the downside. Since we are in a bear market (the primary trend is down), odds of the negative outcome are increased.


                  Rest of article.
                  Jim 69 y/o

                  "...Texans...the lowest form of white man there is." Robert Duvall, as Al Sieber, in "Geronimo." (see "Location" for examples.)

                  Dedicated to the idea that all people deserve a chance for a healthy productive life. B&M Gates Fdn.

                  Good judgement comes from experience; experience comes from bad judgement. Unknown.

                  Comment


                  • Re: Bearish Information Re. Swenlin

                    Originally posted by Jim Nickerson View Post
                    here's my ass ending wedgie call...


                    flip a coin... and my calls are as good as his. go ahead. track 'em.

                    the market is going down, tho. but not cause of the wedgie. look at the fannie spreads over t bonds. here we go again.

                    Comment


                    • Re: Bearish Information Re. Swenlin

                      Originally posted by metalman View Post
                      here's my ass ending wedgie call...


                      flip a coin... and my calls are as good as his. go ahead. track 'em.

                      the market is going down, tho. but not cause of the wedgie. look at the fannie spreads over t bonds. here we go again.
                      So, metalman, are you making a call here that the move up in US equities since 15 July is over?

                      You should make it a point to visit these two threads and put up your calls. You could establish your own track record, and if you do well you might even develop a following.

                      I'm positioned for a down move in equities, real estate, and the financials again, but it remains to be seen if it will be profitable. Personally, I think I will make more money this way than being long PM's in here, though PM'S should bounce, perhaps gold to 850, but I have thought that for several days and have been wrong.
                      Jim 69 y/o

                      "...Texans...the lowest form of white man there is." Robert Duvall, as Al Sieber, in "Geronimo." (see "Location" for examples.)

                      Dedicated to the idea that all people deserve a chance for a healthy productive life. B&M Gates Fdn.

                      Good judgement comes from experience; experience comes from bad judgement. Unknown.

                      Comment


                      • Re: Bearish Information Re. Swenlin

                        Originally posted by Jim Nickerson View Post
                        So, metalman, are you making a call here that the move up in US equities since 15 July is over?

                        You should make it a point to visit these two threads and put up your calls. You could establish your own track record, and if you do well you might even develop a following.

                        I'm positioned for a down move in equities, real estate, and the financials again, but it remains to be seen if it will be profitable. Personally, I think I will make more money this way than being long PM's in here, though PM'S should bounce, perhaps gold to 850, but I have thought that for several days and have been wrong.
                        cool. we'll give them a catchy marketing gimmick name like metalpoint. yeh. and i'll say an assending wedgie means down. yeh.

                        seriously, no one knows where markets go short term. i'm just saying i'd be as wrong as the guy you quote and jim cramer and the wonder monkey... whatever. long term is another matter. i'm with the debt deflation bear market call. i'm on board with the dollar down until the fire economy burns out and is displaced. the little black boxes go whir, whir, whir, and commodities go down when the central banks toss money into hank's machine to bale the bonar so goldman makes a killing and in the end... so what?

                        the bonar is still a wreck, as is the euro and all these other phony government managed economies. and we're still out of cheap oil. and we're still stuck driving these stupid cars on 4 million miles of asphalt made of oil that sits under our enemy's soil. yeh, we'll innovate or bomb our way out of it.

                        Comment


                        • Re: Bearish Information Re. End of Equity Rally--Merrill

                          http://www.marketwatch.com/news/stor...0128C30C27A%7D

                          Credit spreads point to end of equity rally, Merrill says

                          NEW YORK (MarketWatch) - Credit spreads, which represent the gap between corporate debt and Treasury yields, have been a pretty good predictor of how stocks perform - and they're not looking good.

                          When credit spreads widen, it signals investors are attaching more risk to lending money to companies. And wider spreads tend to foreshadow the stock markets' next move, according to Merrill Lynch chief North American economist David Rosenberg.

                          When credit spreads rise, as they are doing now, the equity market goes the other way 88% of the time, he said.

                          "Credits spreads, especially in the financial sphere, may remain vulnerable to upside pressure and this will only reinforce the vulnerability of this bear market rally in equities," Rosenberg wrote in a note.

                          For example, in mid-June, the spread between 10-year Baa-rated bonds -- the lowest investment grade rating -- and U.S. Treasurys (UST10Y: U.S. Treasury 10 Year UST10Y 3.82, +0.00, +0.1%) narrowed to 290 basis points, or 2.90 percentage points. That came exactly a month before the S&P 500 index ($SPX: S&P 500 IndexLast: 1,266.69-11.91-0.93% recovered, Rosenberg said.

                          Now, the spread has again widened to 326 basis points, nearly as wide as in mid-March when the near-bankruptcy of Bear Stearns sent investors fleeing corporate debt and prompted a massive government intervention, including the firm's purchase by J.P. Morgan. (JPM: JPMorgan Chase & CoLast: 35.58-1.16-3.16%.

                          Although spreads have been widening over the past month, the S&P 500 has managed to rally 7% -- as of Monday -- after hitting a intermediate low in mid-July. The shares of financial firms were leading the rally, even though their corporate bonds have continued to lag behind other debt.

                          "So, we feel that investors should be put on notice that the divergence we have seen take place in the past month is unlikely to be sustained, in our view," Rosenberg said.
                          I get an email from John Mauldin's Outside the Box each week, and this week it has a full report by Rosenberg in which among other things he discussed the

                          Three markers to turn us bullish

                          In terms of what are some of the markers that I'm weighing down to turn more bullish? I think this is very important. I look at not so much where am I going to be wrong, but looking at what are the things that will turn me more positive? There are three markers that I have laid down. The first marker is the personal savings rate. I have to see the personal savings rate go back to the pre-bubbles, normalized levels, which was 8%. I'm not talking about the Jurassic period here. I'm talking about where we were in the late 1980s and the early 1990s, before the last two bubbles. That's why I said plural.
                          We had a tech stock bubble followed very quickly by a housing bubble. This had tremendous implications for perceived net worth and perceived future asset growth of the household sector. It had monumental impact on how people spent their after-tax income. That's why we got to a point last year where briefly the savings rate got to negative for the first time since the 1920s. There was a belief system that we could retire on our assets, and now these assets are deflating and people's expectations of how they're going to retire is going to force that savings rate higher. That's going to be very disinflationary, by the way.
                          I think it's important to note that, in 2002, as the tech sector was deflating, Greenspan and Bernanke decided that it was a good idea to re-slate the housing stock as an antidote to the deflation in the tech capital stock. This is almost a piece of Mary Shelley's Frankenstein; we built the monster, now we have to tear it down. I don't know what else is left. We've had an equity bubble followed by a housing bubble, followed by a credit bubble. I don't think there are any more rabbits in the hat to create the next bubble, unless that bubble is going to be in Treasuries, and maybe that is, in fact, going to happen. It's pretty clear that the Fed is going to be concentrating a lot more in the future on non-traditional measures to ease monetary conditions, and not just cutting the Fed fund rate. Part of that may be reflating by expanding its balance sheet, which means that it's not just talk. The Fed is actually going to add to its balance sheet, and that's exactly what happened.
                          1) Need to see the savings rate go to eight percent

                          With the Bank of Japan and the operations they conducted back in the 1990s, this is just stuff to consider for the future. Let me just say that a savings rate of 8% would leave me feeling very good about the fact that we would have gone to a level of pent-up demand that would help us embark on the next bull market and economic expansion. That's going to take quite a bit of time. This is a process. This a process we're talking, even after the recession ends, that's going to be an elongated recovery, as there was in the early 1990s, after that asset cycle. Remember, the recession might have ended in November 2001, but that did not give you a "get out of jail free" card as an equity investor, and certainly the recovery was a good two years away, even if the recession technically ended at the end of 2001. I'm talking about the markers that will turn me bullish for the next cycle. An eight percent savings rate, to me, would be a very critical launching pad.
                          2) Months supply below eight months

                          What else? Well, I doubt that anything is really going to bottom, including the financials, until we're convinced that house prices have hit bottom. For that we have to look at the inventory to sales ratio, and there are different measures. There is the new inventory, which is a 10-month supply. There's the resale; that's 11-month supply. When I take a look at the Census Bureau data, which includes total vacant units for sale, single-family, condo, it's more like 17-month supply. We need to include everything, including foreclosed properties. I have to see that number sliced in half. I have to see it down below eight months supply before I'll be convinced home prices don't bottom, at least the second derivatives start to turn positive. I have to see that metric at the eight-month supply. I'm keeping a very close eye on it. That will make me feel a lot more comfortable with turning bullish for the next cycle.
                          3) Interest coverage ratio has to come down to 10.5%

                          The third and last marker comes down to the household balance sheet. What I'm referring to here is interest coverage in the household sector. We have a record debt-income ratio, but that's a stop-to-flow concept. I'm talking about interest coverage, how much are principal and interest payments from the record debt absorbing out of household income? It is 14.1%. It's at a near-record high. We have never been in a recession with this metric at this level. So, that means there are too many things that are levels we've never seen before. The whole thing about economic bottling is you run the rest of it based on the past, and there are so many things that we're entering into this thing that I've never seen before.
                          There is, I'd have to admit, a wide dispersion around the forecast I am providing. What I am really trying to do is put things into a certain perspective. What I know, being an economist, is that in some sense you're a glorified historian. So when I take a look at the chart of interest coverage in the household sector, what do I see? I see that after the recession of the early 1980s, this interest coverage ratio got down to 10.5% by 1982 and, voila, that was the touch-off point for a multi-year bull market and economic expansion.
                          Then we had the recession of the early 1990s, and what do you know? In 1992, interest coverage went down to 10.5% again. That was the launching pad for a multi-year bull market and economic expansion. We're 14.1% in this metric today. I know this historical record tells me that there is something about a 10.5% ratio that is a very cathartic event. The problem is that to get there from here would require the elimination of $2 trillion of household debt. So, maybe when NYU's Nouriel Roubini talks about that the total losses could be up to $2 trillion, maybe he's not talking through a paper bag.
                          Frugality is going to set in

                          As far as I know, there are only two ways to eliminate debt. You either walk away from it, which people obviously are doing, which is why we got these write-downs and these foreclosures, or you pay it down. I think people with a FICO score that they are concerned about are going to pay that down. That means that the savings rate is going to be forced higher. This, again, is going to be very, very disinflationary. It means that fashions are going to change. It means frugality is going to set in. We're going to be living in smaller houses, driving smaller cars and living more frugally. It's not going to be the end of the world; it's going to be a necessary process to truly embark on getting the balance sheets down to more comfortable levels so that we can actually embark on the next cycle.
                          Intense deleveraging in the banking sector

                          The whole thing about being an economist is that you're being requested to model behavior. What I found recently was three signs of significant changes in behavior. We obviously know of at least one investment bank that is taking aggressive action to sell assets and to deleverage. That's going to force a lot of action in other parts of the industry. What we're talking about here is intensified deleveraging in the banking sector.
                          Inventories cut by $62 billion despite tax stimulus

                          What else did we see? Well, those GDP numbers were just fascinating when you dig through them. Think about it for a second. How did businesses respond to the biggest tax stimulus of all time? They cut their inventory by $62 billion. Can you fathom that? Instead of boosting production as a result of the stimulus, they just allowed the stimulus to absorb past production. We already know that the inventory component went down another five points based on the July ISM number, so this inventory liquidation process is continuing.
                          Savings rate boosted despite stimulus too

                          Alan Greenspan cut his teeth on inventory investment cycles. So banks are deleveraging, and companies are liquidating inventories. How did households respond to the biggest tax stimulus of all time? They boosted their savings rate from 0.3% in the first quarter to 2.6% in the second quarter, which is only the third steepest increase in the savings rate in any given quarter in the past 55 years. Now you probably didn't read that in the front page of The Wall Street Journal, but I find that to be a very relevant statistic.
                          So we have financial sector deleveraging. We have business sector inventory liquidation overlaid with the households boosting their savings rate. These are new themes, and the theme is about getting small. That's going to play very well into Rich Bernstein's decision two months ago to allocate an extra 15 percentage points to his fixed income portfolio. Now we're talking about fixed income. We're talking about bonds that are high quality and have non-callable protection.
                          Nominal GDP growth has highest correlation with yields

                          I'll tell you that the really key forecast next year coming from the economics department here is the nominal GDP, nominal, price times quantity, because we're calling for nominal GDP growth next year to average 1.5%. That is going to be very bullish for sectors that have proven earnings stability and reliable dividend growth, and it's going to be very bullish for bonds. I say that, because I know that the critical driving factor for bonds is not fiscal deficits. It's not the dollar and, guess what, it's not commodities. Nominal GDP growth has the highest correlation. People look and they say, "Four percent 10-year note; who'd want to touch it?" The reality is that nominal GDP growth this year is averaging 4%. The fact that the 10-year note is averaging 4% is not really a big mystery, if you're looking at the macro underpinnings.
                          Now, if I'm right on 1.5% nominal GDP growth for next year, all I can tell you is that the last time we had a condition like that was in 1958. All I can tell you is that 1958, the funds rate averaged to 1.5% and the 10-year note averaged 3%. If you're going to ask me if we have a realistic chance of going back and retesting the June 2003 lows and the 10-year note or the March 2008 lows and the 10-year note, I firmly believe that's going to happen. I believe that's going to also provide you with very handsome total returns.
                          I cannot find a link to the entire article, maybe someone else can. The whole article titled "The Elusive Bottom, dated 8/14/08 is one of the better things I've read in a while.
                          Jim 69 y/o

                          "...Texans...the lowest form of white man there is." Robert Duvall, as Al Sieber, in "Geronimo." (see "Location" for examples.)

                          Dedicated to the idea that all people deserve a chance for a healthy productive life. B&M Gates Fdn.

                          Good judgement comes from experience; experience comes from bad judgement. Unknown.

                          Comment


                          • Re: Bearish Information Re. Be maximally defensive.

                            http://online.barrons.com/article/market_watch.html

                            I have no idea who this guy is, but Barron's abstracted a part of his report--which I think these guy's submit to Barron's for free.

                            Time to Play Defense
                            A Look at Investing by TrueContrarian.com
                            P.O. Box 1894, New York, N.Y. 10008

                            Aug. 17: U.S. equities have been forming a pattern of marginally higher readings -- rising just enough to shake out misinformed or uncommitted amateurs who do not realize that we are about to enjoy the sharpest phase of the entire U.S. equity correction which began in October 2007. QQQQ is a fund of the top 100 Nasdaq companies by market capitalization; the next several weeks will likely see this and similar funds plummet by 25%, as U.S. equities retest important support levels from 2005-06.

                            Recent astonishingly low intraday volatility readings...confirm that U.S. equity investors are overly complacent, when they should be maximally defensive.
                            -- Steven Jon Kaplan
                            To my reckoning this is a rather agressive call, but who knows?

                            In the same issue, today, Byron Wien's opinion in an interview:

                            http://online.barrons.com/article/SB...e_main&page=sp


                            What's your take on the U.S. recession?

                            We are in a recession, but there are two parts of it that you haven't seen yet.

                            The first part is an increase in unemployment, and the second is a collapse in consumer credit.

                            You've seen it in housing, which is a form of consumer credit, and in finance. But we are in a recession, and we are not going to come out of it until sometime next year at the earliest. The market will discount that by six to nine months. I have said that the market low on July 15 was a very significant low. I am not saying it won't be tested, but I don't think it will be severely penetrated.
                            JN Emphasis.
                            Last edited by Jim Nickerson; August 23, 2008, 10:52 AM.
                            Jim 69 y/o

                            "...Texans...the lowest form of white man there is." Robert Duvall, as Al Sieber, in "Geronimo." (see "Location" for examples.)

                            Dedicated to the idea that all people deserve a chance for a healthy productive life. B&M Gates Fdn.

                            Good judgement comes from experience; experience comes from bad judgement. Unknown.

                            Comment


                            • Re: Bearish Information RE. Richard Russell--Deflation

                              Richard Russell (Dow Theory Letters): On the eve of world deflation
                              Originally posted by Russell

                              “I believe we are on the eve of world deflation. I pulled out a headline from the August 5 Wall Street Journal headline – ‘INFLATION PACE IS FASTEST IN 17 YEARS’.

                              “Forget it, this is history – this is not what’s happening in the market. From what I see, the markets are telling us to prepare for hard times, and a global spate of the worst deflation to be seen in generations. This is why gold has been sinking, this is why stocks have been falling – big money, sophisticated money, is cashing out, raising cash, preparing for world deflation. This is probably why Lowry’s Selling Pressure stays at its high, smart money is selling into the stock market, day after day. They’re raising cash in preparation for the hard times when deflation is in the saddle.

                              “Deflation is ushering in the new strong dollar. Big money sees deflation and the lower rates that go with deflation. Look, if you have five million dollars and you are only receiving 2% in interest on your money, that’s only an income of hundred thousand dollars on your five million. Big money realizes that in a deflation you need a mountain of cash to keep up your lifestyle.

                              “What I see is a coming world deflation, and I believe that’s the message the markets are sending. What’s the best stance in a deflationary situation? Lots of cash, and safe, solid, investments. Two areas that fit that requirement – US dollars and US Treasury paper. What happens to stocks during deflationary times? They’re sold to raise cash. What happens to business in deflationary times? It’s crushed by ever-lower prices. What happens to the average citizen who’s loaded with debt during deflationary times? They’re battered unmercifully, as income buys less and less and as debt crushes them. What happens to assets during deflationary times? They’re worth less and less and their sale brings in fewer and fewer dollars. Isn’t the price of gold and oil already telling us that?

                              “I just finished reading The New York Times, Los Angeles Times and Barron’s and there isn’t a hint of what I’m writing about above in any of these publications. Unfortunately, these coming deflationary times will come as a complete surprise to most people.”

                              Source: Richard Russell, Dow Theory Letters, August 18, 2008.

                              As I understand from reading iTulip deflation almost could not possibly happen. However, Finster, just yesterday updated his site that depicts his Finster Dollar Index (FDI) and

                              Originally posted by Finster
                              The hard stuff, El Bartos. De-freaking-flation!
                              Remember that unlike most 'flation guages, the FDI is sensitive to short-term movements. Technically disinflation would show as a shallower slope of decline, an outright rise is always deflation. Only if a rise were to persist at a high rate and/or for a substantial period of time (e.g. as in 2000-2002) would conventional measures begin to register deflation.

                              Keep in mind the FDI only registers what has already happened (even if it is more timely than conventional price inflation guages). Whether and to what extent the trend may continue might be better guided by your monetary indicators ...
                              Jim 69 y/o

                              "...Texans...the lowest form of white man there is." Robert Duvall, as Al Sieber, in "Geronimo." (see "Location" for examples.)

                              Dedicated to the idea that all people deserve a chance for a healthy productive life. B&M Gates Fdn.

                              Good judgement comes from experience; experience comes from bad judgement. Unknown.

                              Comment


                              • Re: Bearish Information Re. Hussman

                                8/24/08 http://hussmanfunds.com/wmc/wmc080825.htm

                                Originally posted by Hussman
                                With both the markets and underlying conditions relatively unchanged in the past week, we continue to remain defensive, and alert to a more pointed degree than usual. The stock, bond and foreign exchange markets continue to trade essentially on the theme that the global economy is weakening, but that the U.S. has dodged a recession. This strikes me essentially as an artifact of lagging indicators such as the unemployment rate (on which the full force of the current economic downturn has yet to be felt) as well as various coincident indicators such as the ISM survey and capacity utilization, which are still hovering at tepid levels without clearly breaking down.

                                I'll emphasize again that at the point we do observe sufficient evidence for investors to concede recession, the potential downside could be abrupt, leaving little opportunity to make defensive changes after the fact. As I've often said, the best time to panic is before everybody else does.

                                Among the factors that concern me here is the continued widening of credit spreads, which increasingly suggests that default risk may be starting to spread beyond the financial sector into the broader economy. Meanwhile, there is a relative complacency in the stock market because investors are still convinced that the extreme “tail risk” in the markets has been removed by the Federal Reserve and the U.S. Treasury.

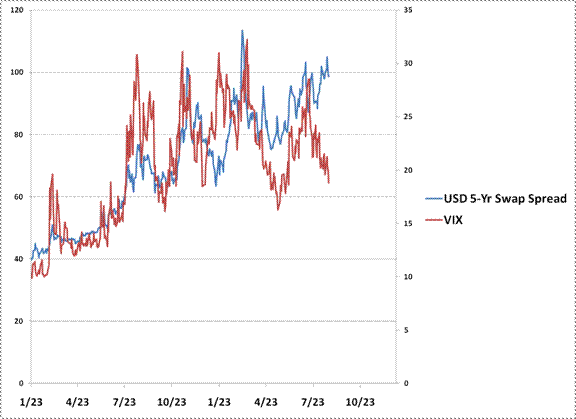
                                We observe that complacency in the continued low level of option volatilities. Much of the value of options is in the small probability of very large moves. If you remove that tail risk, option premiums become much less expensive, and that's how options are trading at present. Unfortunately, implied volatilities tend not to be terribly good predictors of actual subsequent market volatility, so we can't take the low VIX as any sort of “collective intelligence” about market prospects. Typically, low volatilities are observed prior to poor market performance, with the worst performance often following a low VIX that breaks out moderately to the upside. For that reason, fluctuations in the VIX, particularly any move beyond 25-27, are worth watching here.

                                Years ago, Larry Williams used to look for a situation he called the “Jaws of Death” – noting that when bond prices were weakening but stock prices were strengthening, the two differing trends opened a set of “jaws” that tended to snap shut, usually due to abrupt weakness in stocks. On that note, Bill Hester sent a chart over the weekend noting “I thought this was an interesting graph. The blue line is the 5-Yr Swap Spread, and the red line is the VIX. Credit investors are getting very nervous while equity investors are mostly whistling Dixie. It looks like a variation on the jaws of death that you've mentioned to me before….” Nothing like a good picture to complete the story (thanks Bill).


                                In short, the markets are presently trading on a theme that largely overlooks the potential (and in my view, the reality) of a significant U.S. recession. At the point of recognition, we may very well observe abrupt weakness in both stock prices and the U.S. dollar.
                                Emphasis JN

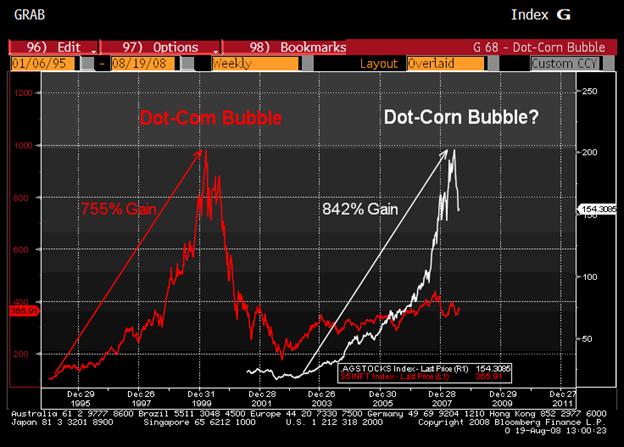
                                An interesting comparison of runs up in dot-com and recently corn (dot-corn) from same Hussman note.

                                Last edited by Jim Nickerson; August 24, 2008, 11:27 PM.
                                Jim 69 y/o

                                "...Texans...the lowest form of white man there is." Robert Duvall, as Al Sieber, in "Geronimo." (see "Location" for examples.)

                                Dedicated to the idea that all people deserve a chance for a healthy productive life. B&M Gates Fdn.

                                Good judgement comes from experience; experience comes from bad judgement. Unknown.

                                Comment

                                Working...
                                X