 Tweet
Tweet
Re: Just another day @ the FED
I don't know who you are referring to as "brain dead," piffle, but anyone who looks at those charts, unless they are as smart as bart may be and draw conclusions from them is weak brained as far as I am concerned.
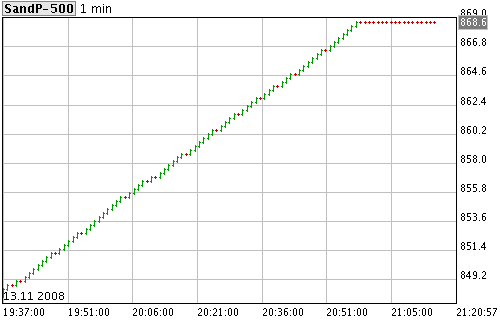
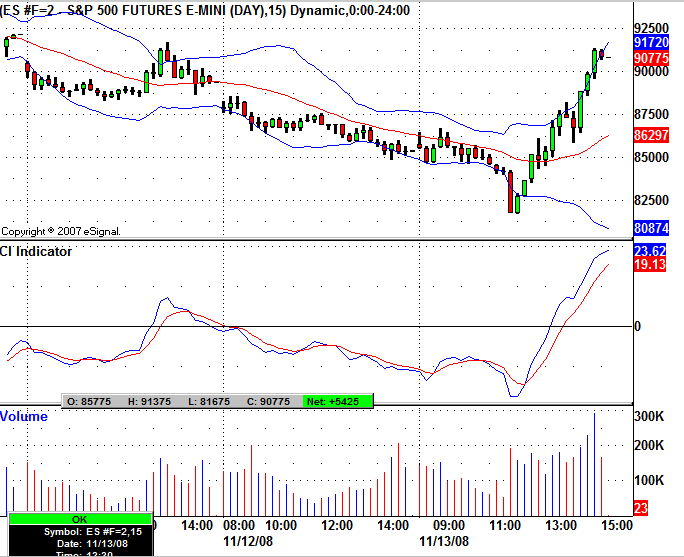
My question to bart is: if the futures quoted in a foreign currency show that pattern, why not just put up what the futures chart shows in the US$? Maybe they would be exactly the same, I don't know.
I'm not arguing about whether or not there is intervention. So what if there is, or has been during the other big up days, the markets were later lower. Also, when markets are severely oversold they tend to bounce, and those bounces cannot all be explained on intervention, (maybe some short covering or a lot of people thinking prices are good). If the up days are explained on some sort of intervention, what explains the near equally large down days: withdrawal of intervention? We are in a bear market of historical proportions and I don't think anyone here has seen its exact likes. As long as the +300 days up or down keep occurring I believe we continue to be in a bear market of basically uncharted waters.
Originally posted by pfife
View Post
My question to bart is: if the futures quoted in a foreign currency show that pattern, why not just put up what the futures chart shows in the US$? Maybe they would be exactly the same, I don't know.
I'm not arguing about whether or not there is intervention. So what if there is, or has been during the other big up days, the markets were later lower. Also, when markets are severely oversold they tend to bounce, and those bounces cannot all be explained on intervention, (maybe some short covering or a lot of people thinking prices are good). If the up days are explained on some sort of intervention, what explains the near equally large down days: withdrawal of intervention? We are in a bear market of historical proportions and I don't think anyone here has seen its exact likes. As long as the +300 days up or down keep occurring I believe we continue to be in a bear market of basically uncharted waters.
Comment