Announcement

Collapse
No announcement yet.

Will long treasury rates be 10% soon?

Collapse
X
 
  • Filter
  • Time
  • Show
Clear All
new posts

  • #16
    Re: Will long treasury rates be 10% soon?

    So, Finster, is your skill and mind adequate and agile enough, your time permitting, to put up an example of what the "bullish case" and "bearish case" would earn or lose using for example a 10,000 investment say in TLT?

    Is that too much to ask of you?

    I personally have held off going long interest rates with the potential of using TBT which I remember is leveraged, or one of the Profunds for the TNX or TYX which are less leveraged. Held off because I can't come to my own opinion about when interest rates might stop going down.
    Jim 69 y/o

    "...Texans...the lowest form of white man there is." Robert Duvall, as Al Sieber, in "Geronimo." (see "Location" for examples.)

    Dedicated to the idea that all people deserve a chance for a healthy productive life. B&M Gates Fdn.

    Good judgement comes from experience; experience comes from bad judgement. Unknown.

    Comment


    • #17
      Re: Will long treasury rates be 10% soon?

      good stuff! the bull scenario sure looks less mean reverting than the bear case. i never bet against the mean reversion long term.

      the 1971 to 1985ish period is all about the world 'adapting' to the global fiat dollar.

      noted ej is now 'optimistic' (if that is the right term) about global reflation by fiscal spending putting off 'poom' for a spell. or maybe he's asking us to think about that vs the currency wars or new currency order case. or maybe we get both.

      i'm batting down the hatches for general international trade and currency chaos with each nation using fiscal stimulus independently.

      Comment


      • #18
        Re: Will long treasury rates be 10% soon?

        Originally posted by Finster View Post
        ... especially note the power and persistence of the larger pattern, undisturbed by war, peace, prosperity and depression.
        Dang ... you can be persuasive when you set your mind to it.

        I'd guess that the corresponding charts for countries whose Central Banks failed or countries which lost a major war don't look so predictable.

        Your charts show the time between the end of the Civil War and now. During that time, the same Money Masters (Rothschild, Warburg, Rockefeller, Morgan, and associates and descendents, such as the BIS, the Fed, the U.S. Treasury, JPMorgan Chase, ...) have dominated banking in the United States, and the United States has not lost a major war nor suffered a financial collapse sufficient to unseat or impoverish these Money Masters.

        Perhaps it is this continuity of control of our banking system which your long bond charts show?

        In any event, some day, this too shall end.

        Granted, it's only on my most paranoid days, when The Mogambo Guru seems too mellow for my tastes, that I fear that This End is Near.
        Most folks are good; a few aren't.

        Comment


        • #19
          Re: Will long treasury rates be 10% soon?

          Originally posted by Jim Nickerson View Post
          So, Finster, is your skill and mind adequate and agile enough, your time permitting, to put up an example of what the "bullish case" and "bearish case" would earn or lose using for example a 10,000 investment say in TLT?

          Is that too much to ask of you?

          I personally have held off going long interest rates with the potential of using TBT which I remember is leveraged, or one of the Profunds for the TNX or TYX which are less leveraged. Held off because I can't come to my own opinion about when interest rates might stop going down.
          As you're probably aware, TLT tracks an amalgam of 20-30 UST, while the rates above are for 10 year constant maturity. What's more, maturity itself doesn't relate tightly to price; you need to know duration for that; and duration is not only a function of maturity but of interest rates themselves. So we can get only a rough estimate.

          Since we don't have the exact rate and maturity data anyway, the simplified rule of thumb is appropriate: Price varies inversely to the product of the change in interest rates and the duration. So if you assume a 1% change in rates at a duration of 20 years (roughly corresponding to the 30 year maturity of the long bond) you get a price change of in the neighborhood of 20%.

          If you are into partial differential equations, you may enjoy Wikipedia's mathematical discussion of duration...
          Finster
          ...

          Comment


          • #20
            Re: Will long treasury rates be 10% soon?

            Originally posted by metalman View Post
            good stuff! the bull scenario sure looks less mean reverting than the bear case. i never bet against the mean reversion long term.

            the 1971 to 1985ish period is all about the world 'adapting' to the global fiat dollar.

            noted ej is now 'optimistic' (if that is the right term) about global reflation by fiscal spending putting off 'poom' for a spell. or maybe he's asking us to think about that vs the currency wars or new currency order case. or maybe we get both.

            i'm batting down the hatches for general international trade and currency chaos with each nation using fiscal stimulus independently.
            Yeah, Metal, the reason for presenting both the bull and bear cases there is the power of forces tugging in either direction. You're familiar with the fundamental arguments; technically both sides have credibility as well.

            That for the bull case might not be as obvious as simple mean reversion. But if you examine the pattern closely you see not only that broad, sweeping bouncing ball formation, but in the last few cycles decorating it there is something interesting. You see at one point a single almost monotonic downward plunge. At the next you see a larger upward spike, but one which is composed of two subparts: first an upward thrust, a period of zig-zagging consolidation, followed by another upward thrust. Look at where we are right now ... we've just completed a "first" upward thrust and appear to have entered a period of "zig-zagging consolidation" not unlike that of 1997-1998 and 2002-2003. That implies a second upward thrust to come.

            Of course, nothing is assured, least of all in times like these. Taking all the available information together, my conclusion is that the odds for the bear and bull cases are pretty evenly split. My main point here is to put some tentative limits on the size of the expected move over the next couple of years, regardless of which direction it may take.

            Longer term is another matter altogether. It's extremely likely we are at the cusp of a very deep, multi-decade bear market in UST prices.
            Finster
            ...

            Comment


            • #21
              Re: Will long treasury rates be 10% soon?

              Originally posted by ThePythonicCow View Post
              Dang ... you can be persuasive when you set your mind to it.

              I'd guess that the corresponding charts for countries whose Central Banks failed or countries which lost a major war don't look so predictable.

              Your charts show the time between the end of the Civil War and now. During that time, the same Money Masters (Rothschild, Warburg, Rockefeller, Morgan, and associates and descendents, such as the BIS, the Fed, the U.S. Treasury, JPMorgan Chase, ...) have dominated banking in the United States, and the United States has not lost a major war nor suffered a financial collapse sufficient to unseat or impoverish these Money Masters.

              Perhaps it is this continuity of control of our banking system which your long bond charts show?

              In any event, some day, this too shall end.

              Granted, it's only on my most paranoid days, when The Mogambo Guru seems too mellow for my tastes, that I fear that This End is Near.
              You bet it shall end ... it's just that the odds of it doing so at any specific time are a little like those of winning the lottery ... you know someone will, but exactly who is a different matter altogether ...

              Even if it doesn't end soon, though, the longer term outlook for the UST market isn't pretty. Even assuming the pattern holds, we are staring down the barrel of a deep multi-decade plunge in UST prices ... i.e. rising UST rates. And keep in mind my remarks above about the two different ways in which UST values can fall ... deep losses can happen even without a fall in prices or rise in rates, they can come via depreciation of the dollar itself.


              P.S. ... we share your taste for Mogambo ...
              Finster
              ...

              Comment


              • #22
                Re: Will long treasury rates be 10% soon?

                Originally posted by Finster View Post
                As you're probably aware, TLT tracks an amalgam of 20-30 UST, while the rates above are for 10 year constant maturity. What's more, maturity itself doesn't relate tightly to price; you need to know duration for that; and duration is not only a function of maturity but of interest rates themselves. So we can get only a rough estimate.

                Since we don't have the exact rate and maturity data anyway, the simplified rule of thumb is appropriate: Price varies inversely to the product of the change in interest rates and the duration. So if you assume a 1% change in rates at a duration of 20 years (roughly corresponding to the 30 year maturity of the long bond) you get a price change of in the neighborhood of 20%.

                If you are into partial differential equations, you may enjoy Wikipedia's mathematical discussion of duration...
                Originally posted by Finster View Post
                Yeah, Metal, the reason for presenting both the bull and bear cases there is the power of forces tugging in either direction. You're familiar with the fundamental arguments; technically both sides have credibility as well.

                That for the bull case might not be as obvious as simple mean reversion. But if you examine the pattern closely you see not only that broad, sweeping bouncing ball formation, but in the last few cycles decorating it there is something interesting. You see at one point a single almost monotonic downward plunge. At the next you see a larger upward spike, but one which is composed of two subparts: first an upward thrust, a period of zig-zagging consolidation, followed by another upward thrust. Look at where we are right now ... we've just completed a "first" upward thrust and appear to have entered a period of "zig-zagging consolidation" not unlike that of 1997-1998 and 2002-2003. That implies a second upward thrust to come.

                Of course, nothing is assured, least of all in times like these. Taking all the available information together, my conclusion is that the odds for the bear and bull cases are pretty evenly split. My main point here is to put some tentative limits on the size of the expected move over the next couple of years, regardless of which direction it may take.

                Longer term is another matter altogether. It's extremely likely we are at the cusp of a very deep, multi-decade bear market in UST prices.
                Thanks, Finster, personally I think TUS was correct.

                I hate to agree with metalman or most things, but this is "good stuff."
                Jim 69 y/o

                "...Texans...the lowest form of white man there is." Robert Duvall, as Al Sieber, in "Geronimo." (see "Location" for examples.)

                Dedicated to the idea that all people deserve a chance for a healthy productive life. B&M Gates Fdn.

                Good judgement comes from experience; experience comes from bad judgement. Unknown.

                Comment


                • #23
                  Re: Will long treasury rates be 10% soon?

                  Originally posted by Finster View Post
                  Yeah, Metal, the reason for presenting both the bull and bear cases there is the power of forces tugging in either direction. You're familiar with the fundamental arguments; technically both sides have credibility as well.

                  That for the bull case might not be as obvious as simple mean reversion. But if you examine the pattern closely you see not only that broad, sweeping bouncing ball formation, but in the last few cycles decorating it there is something interesting. You see at one point a single almost monotonic downward plunge. At the next you see a larger upward spike, but one which is composed of two subparts: first an upward thrust, a period of zig-zagging consolidation, followed by another upward thrust. Look at where we are right now ... we've just completed a "first" upward thrust and appear to have entered a period of "zig-zagging consolidation" not unlike that of 1997-1998 and 2002-2003. That implies a second upward thrust to come.

                  Of course, nothing is assured, least of all in times like these. Taking all the available information together, my conclusion is that the odds for the bear and bull cases are pretty evenly split. My main point here is to put some tentative limits on the size of the expected move over the next couple of years, regardless of which direction it may take.

                  Longer term is another matter altogether. It's extremely likely we are at the cusp of a very deep, multi-decade bear market in UST prices.
                  as you know, i don't buy the technical stuff, except maybe for illiquid markets where everyone is believing and betting on the same voodoo. if everyone is using charts then charts matter. 10 yr bonds ain't one of them.

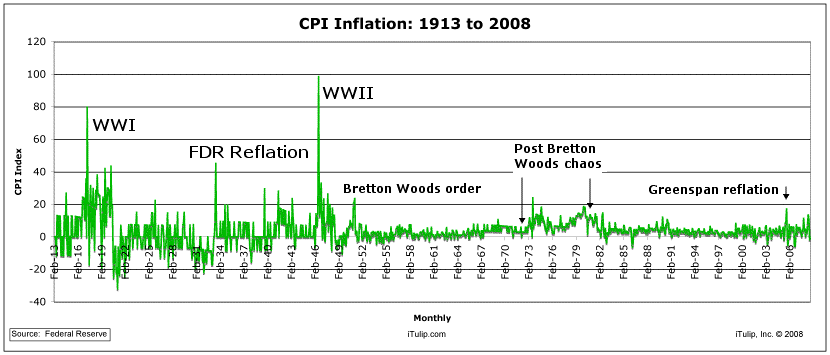
                  the way i see it this is correlated to political/economic epochs. for validation, compare to the long term inflation charts.


                  that dip in 1920 is ww1 inflation. that diip in 1934 is fdr's reflation. the crash in 1980 is 'the great inflation' after nixon punted the gold dollar in 1971. and so on. each change corresponded to something going on in the us and world economy. the big questions this fantastic chart raises... why the long slow drop since ww2? the crash at the end is the gold default, but what about the long trend? overall deteriorating us relative global economic hegemony? why the volatility on the climb back out of 1980? fire economy/bubble effects? in that context, i can't help feeling that something big is about to go down and it ain't dollar or long bond positive.


                  check it...

                  Factory closure in China a sign of global woes

                  DONGGUAN, China (AP) -- Unemployed worker Wang Wenming was angry at his boss for shutting down a massive Chinese factory this week that made toys for Mattel Inc., Hasbro Inc. and other American companies.

                  But the assembly line worker was also furious at the United States.

                  "This financial crisis in America is going to kill us. It's already taking food out of our mouths," the 42-year-old laborer said Friday outside the shuttered Smart Union Group (Holdings) Ltd. factory in the southern city of Dongguan.

                  The company, which has struggled as global growth has slowed in recent months, employed 7,000 people in mainland China and Hong Kong. It wasn't immediately clear how many have lost their jobs.

                  Economic upheaval in the U.S. is already changing and shrinking China's vast manufacturing hub in the southern province of Guangdong, long regarded as the world's factory floor. However, factory closures won't just be a China problem -- shoppers will feel the effect in malls and stores in the U.S. and Europe.

                  "When these companies go bust, the outcome is higher prices," said Andy Xie, an independent economist in Shanghai. "Labor costs have gone up 70 to 100 percent in the last three or four years. But these guys have not been able to raise their prices because Toys "R" Us, Home Depot and Wal-Mart are saying no price increase. How is that possible?"
                  For years, there were too many factories competing to win bids from foreign buyers demanding prices that were often unrealistically low. The winners were American and European consumers, who enjoyed rock-bottom prices.

                  But many factories were scrimping on materials and stiffing their suppliers just to survive, Xie said. The financial crisis will be the final culling factor that forces many wobbly factories to go belly up and end an unsustainable situation, he added.

                  Already, China's toy industry is hurting. :eek:The official Xinhua News Agency reported this week that 3,631 toy exporters -- 52.7 percent of the industry's enterprises -- went out of business in 2008.:eek: The causes: higher production costs, wage increases for workers and the rising value of the yuan, the report said.

                  Comment


                  • #24
                    Re: Will long treasury rates be 10% soon?

                    Originally posted by metalman View Post
                    as you know, i don't buy the technical stuff, except maybe for illiquid markets where everyone is believing and betting on the same voodoo. if everyone is using charts then charts matter. 10 yr bonds ain't one of them...
                    Ignore it at your peril! I seriously doubt that for 130 years the US bond market has been directed by people "believing and betting on" that chart pattern. Yet is has proceeded strikingly deterministically. The amplitude of that bouncing ball formation and of the volatilty superposed upon it has increased greatly with the advent of central banking "stabilization", but the overall trajectory just marches on...

                    Originally posted by metalman View Post
                    ...the way i see it this is correlated to political/economic epochs. for validation, compare to the long term inflation charts...
                    You can't get any meaningful validation from such inflation charts. For one thing, they are based on the CPI. Are you prepared to argue the CPI equates to inflation?

                    I didn't think so ... :p

                    For another, inflaton is only one factor in bond yields, and not a very dispositive one at that. Yes, bond yields track inflation, all else being equal, but all else is rarely equal.

                    Bond yields are the inverse of prices, and like any other price represents the ratio of value between the bond and the cash unit, which in turn reflects the supply and demand for each. So a big supply of bonds can depress prices (and raise yields). A big supply of cash, paradoxically, can raise bond prices and cut yields, despite the generally inflationary effect. For example, the supply of cash coming back from BRICOPEC was blamed by Bernanke for depressing interest rates a few years ago. When the Fed wants to goose inflation and creates a lot of new liquidity, that can initially exert upward pressure on bond prices and depress interest rates. (The Fed doesn't usually raise interest rates to get inflation going!) Historic examples abound, for example interest rates were exceedingly low through much of the forties and fifties despite growing inflation.

                    Remember investment instruments compete with each other, not with consumer goods and services. We can't invest in those. If the prices of other investments are high, bond prices tend to be as well. Take for example the stock market crash we just had. Stock prices fell 20% or so in a couple weeks. This means stock yields rose 20% or so in a couple weeks. Since then, we've seen upward pressure on bond yields as well.

                    These are just a few examples of some of the factors affecting bond prices and yields ...
                    Finster
                    ...

                    Comment


                    • #25
                      Re: Will long treasury rates be 10% soon?

                      Originally posted by Finster View Post
                      But if you examine the pattern closely you see not only that broad, sweeping bouncing ball formation, but in the last few cycles decorating it there is something interesting.
                      Interesting - yes.

                      But the sharp, monontonic downward spikes in 1994 and again in 1999 do not look like the more complex downward pattern from 2004 to 2006.

                      I expect sharp monotonic corrections going against the larger trend, and more complex patterns going with the larger trend. That 2004-2006 was a complex downward movement, not a monotonic spike suggests to me that the trend is now downward (increasing yield).

                      By this reading the upward monotonic spike (sharp jump to lower rates) this year (2008) is counter-trend, and seems to have hit bottom (lowest yield, highest visual point on this graph) at about 0.0320.

                      This reading predicts that long bonds yields will now begin rising, in a choppy pattern.

                      Of course, such chart reading is always easier done to analyze the past than to predict the future.
                      Most folks are good; a few aren't.

                      Comment


                      • #26
                        Re: Will long treasury rates be 10% soon?

                        Originally posted by Finster View Post
                        we are staring down the barrel of a deep multi-decade plunge in UST prices
                        Yup. As sure as anything gets in this world (short of death and taxes, of course.)
                        Most folks are good; a few aren't.

                        Comment


                        • #27
                          Re: Will long treasury rates be 10% soon?

                          Originally posted by grapejelly View Post
                          nobody commenting? This is a major bit of analysis. Picture what it will do to the world when rates are this high on the long side. It could happen sooner than anyone thinks.
                          Grapejelly - Here is one technician's call. This was issued two days ago. I find his work to be quite robust. And his short to intermediate term conclusion here is counter to what most of us have expected.

                          REFERENCE CHART REMOVED.
                          Last edited by Contemptuous; November 04, 2008, 03:36 AM.

                          Comment


                          • #28
                            Re: Will long treasury rates be 10% soon?

                            I think the rules are changing as we speak - so don't get to fixed on any idea jmho

                            Comment


                            • #29
                              Re: Will long treasury rates be 10% soon?

                              Originally posted by Lukester View Post
                              Grapejelly - Here is one technician's call. This was issued two days ago. I find his work to be quite robust. And his short to intermediate term conclusion here is counter to what most of us have expected.

                              [ATTACH]779[/ATTACH]
                              One possible exogenous event that could account for such a renewed strengthening of bonds (even lower yields) could be dramatic collapsing of various dollar denominated investments by European banks in various other falling nations, such as referenced in an earlier post of mine: http://www.itulip.com/forums/showthr...8371#post58371

                              Certainly if there is a year for "once in a hundred year extremes", this seems to be it.
                              Most folks are good; a few aren't.

                              Comment


                              • #30
                                Re: Will long treasury rates be 10% soon?

                                Originally posted by ThePythonicCow View Post
                                This reading predicts that long bonds yields will now begin rising, in a choppy pattern.
                                Exactly what I meant in saying that we are looking at a deep multi-decade bear market in UST.

                                That big bouncing ball pattern, by the way, goes back much further than the 130+ years shown on the chart. And not only in US interest rates, but English and European rates as well.

                                In case anyone hasn't already picked up on it, that pattern can be looked upon as a manifestation of the Kondratieff Wave...
                                Last edited by Finster; November 03, 2008, 07:48 AM.
                                Finster
                                ...

                                Comment

                                Working...
                                X