last fall i learned a new word - "plutonomy." i was reading a piece which in passing commented on the new bankruptcy law:
The tougher bankruptcy laws may please the puritans and there is some merit to penalising
profligacy. But they do risk a social backlash in a society where almost one fifth of the income
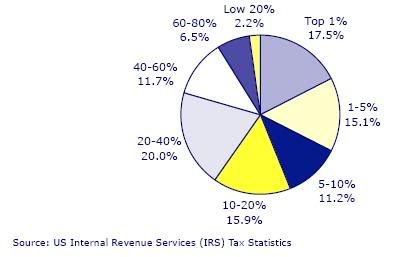
goes to 1% of the population (see Figure), most particularly as it will seem unfair to the
regular folk that companies are not treated the same way as individuals. Investors who live in
the real world, as opposed to academic textbooks, should take note. This point is particularly
relevant with research notes circulating globally about the likelihood of an ongoing global boom
as a consequence of the emergence of plutonomies where the growing wealth of the richest
parts of societies will continue to drive consumption.
US income shares by percentile size-classes, 2003

so i googled "plutonomy" and came across this:
U.S. resilient despite wealth gap
Friday, October 21, 2005; Posted: 7:27 a.m. EDT (11:27 GMT)
WASHINGTON (Reuters) -- It will be no consolation to poorer U.S. households struggling to make ends meet, but rising U.S. income disparity may explain how the world's biggest economy continues to expand rapidly amid repeated shocks.
For those puzzled at how the United States continues to grow well above historical averages despite blistering fuel price rises, rising debt and interest rates and ballooning national deficits, many economists say one answer lies in the American "plutonomy".
In a "plutonomy", according to Citigroup global strategist Ajay Kapur, economic growth is powered by and largely consumed by the wealthy few. Canada and Britain fall into that category too, he says, the euro zone and Japan much less so.
Spurred by capitalist-friendly governments, technology-driven productivity gains, high immigration and strict property rights and patents, Kapur argues the U.S. plutonomy has mushroomed since the early 1980s.
With huge chunks of national income and wealth increasingly concentrated in a tiny percentage of households at the top, national spending, profits and economic growth are disproportionately dependent on the fortunes of that same group.
And the more there is growth in the economy, profits and the price of assets, such as houses and equity, the relatively richer and more significant this group is in assessing nationwide growth.
In other words, calculating how higher energy costs will affect the economy by simply looking at the impact on 'average' American households can be hugely misleading.
"It is easy to drown in a lake with an 'average' depth of four feet - if one steps into the deeper extremes," Kapur wrote in report released this week.
"There is no average consumer in a 'plutonomy'," he said, adding: "Consensus analysis focusing on the average consumer are flawed from the start."
Impact
To be sure, hurricanes Katrina and Rita devastated the lives of millions of poor Americans. Many more now see household budgets squeezed to the limit by the ensuing surge in gasoline and home heating costs.
But the bald facts of rising inequality in America's wealth distribution means the trials of low- and even middle-income families will have only a small impact on gauges of gross domestic product, aggregate spending growth and corporate profits.
Kapur's report highlights consumer finance surveys showing the top one percent of U.S. households -- about 1 million households -- accounted for about 20 percent of overall U.S. income as recently as 2000.
That is only a slightly smaller share than the bottom 60 percent of some 60 million households put together.
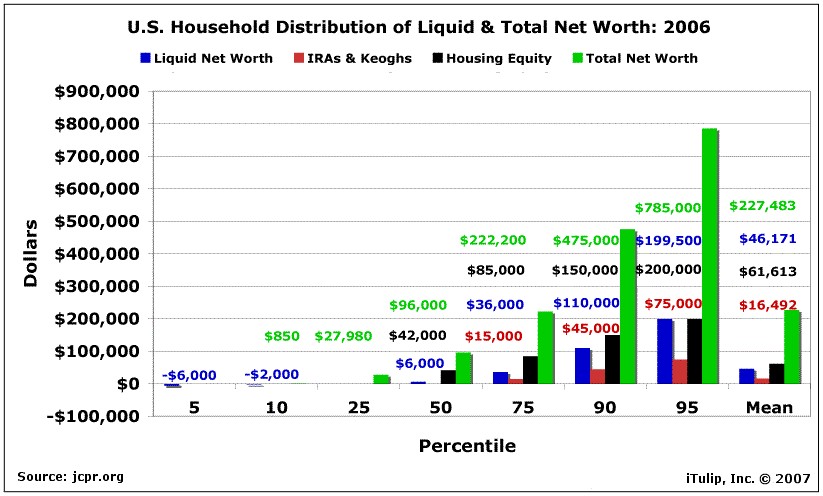
And the top one percent also accounts for a third of household net worth, the difference between household assets -- such as equity or houses -- and debts. That is greater than the total held in the bottom 90 percent.
Economists say the decline in equity values since 2000 may have reduced the skew in this 2001 Survey of Consumer Finances, a triennial survey sponsored by the Federal Reserve. Data from the 2004 survey has yet to be released.
The rise in house prices since then will have distributed asset wealth a little wider than the concentration of equity.
But more recent household surveys ram home the point.
The 2003 Consumer Expenditure Survey shows pre-tax average income of the top quintile income group, at $127,146 per annum, just a thousand dollars short of the combined average income of all of the bottom 80 percent.
And it showed the average expenditure of the top 20 percent of households exceeded the total of the lowest 60 percent.
Dean Maki, Head of U.S. Economic Research at Barclays Capital, said spending by this top quintile seems very unlikely to drop substantially in response to higher energy prices.
Maki, co-author of a 2001 Fed study demonstrating the fall in the U.S. savings rate of rich Americans in response to the 1990s equity boom, said the top quintile are now seeing strong income growth, plentiful jobs and housing and equity gains.
"Energy prices represent a substantially smaller share of spending in these households than for poorer Americans," said Maki. "With fundamentals so positive for this group, we believe spending growth by the wealthy should continue to provide some insurance to the overall consumption outlook."
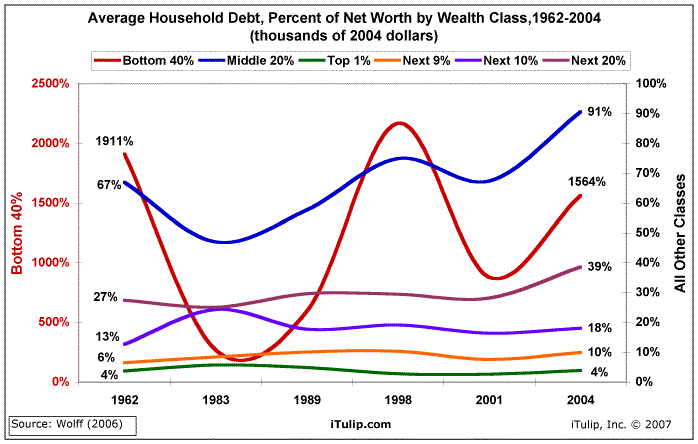
David Kelly, senior economic adviser at Putnam Investments in Boston, reckons debt among poorer households also play a significant part in keeping U.S. consumers seemingly spending beyond their means.
But Maki at Barclays pointed out that a large part of the nationwide debt too is held by the top income quintile and for that group, assets far outweigh debt holdings.
"That's one reason we don't see much of a relationship between aggregate debt burden and consumer spending," he said.
For all the implications of this idea -- and Kapur reckons it goes a long way to explaining the wider issues of global economic imbalances -- many feel the reality of the situation should be obvious too all.
"Whatever about the political system, the U.S. economy is not a democracy -- it doesn't count by heads, it counts by dollars," said Putnam's Kelly.
jk comment nov '05:
Inflation in the wealthy part of the economy - high end homes and Hamptons real estate continue to appreciate. Deflation in the less well-off economy -- lowered wages [as at Delphi and the bankrupt airlines] and rising health care costs, lay offs or pay cuts with higher heating bills. Lower standards of living and indentured servitude under the new bankruptcy law.
the piece that started me down this rabbit hole continued:
We understand all too clearly that the rich have been getting richer in recent years
as a result of free markets and globalisation. But it is highly dangerous to extrapolate blindly
such a trend going forward. The massive divergence in the distribution of income has only been
socially acceptable in recent years in Anglo Saxon societies because the less well off have been
able to go into debt on the back of inflated house values. If that phenomenon unwinds in any
sort of semi-nasty fashion, as is anticipated here, the social contract will be threatened. True,
the political genius of Karl Rove allowed Bush Jnr to get re-elected in a political context where
the average American has in recent years suffered negative real income growth. But in our
view that political Houdini act was also made possible by the consumer purchasing
power generated by home-equity extraction. Thus, net equity extraction financed by home
mortgages totalled US$600bn in 2004, amounting to almost 7% of total household disposable
income, up from US$204bn or 2.8% of disposable income in 2000, according to a recent Fed
research report co-authored by Alan Greenspan (Estimates of home mortgage originations,
repayments, and debt on one-to-four-family residences, September 2005).
The same point applies for political tolerance in America of the Chinese trade surplus. It is a
feature of the latest Chinese macro statistics that China is more geared into export growth than
at any time for the past 10 years. Thus, net exports of goods accounted for 5.3% of GDP in the
first nine months of this year, up from 1.9% in 2004. Furthermore, the increase
in net merchandise exports contributed to an estimated 41% of the nominal GDP growth for the
first three quarters of this year. This means China is more geared to the US economy, and
therefore to the US consumer, than ever before as reflected in the booming bilateral trade
surplus. Thus, China’s trade surplus with the US rose by 48% YoY in the first
nine months of this year to a record US$81.2bn. This has already exceeded the trade surplus
with the US recorded in the whole of 2004. Similarly, the statistical evidence also suggests that
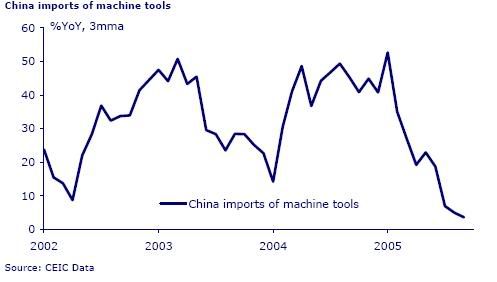
[Chinese] domestic demand is slowing. Thus, the rate of growth of imports of machinery and equipment
is down dramatically. Imports of machine tools rose by only 3.6% YoY in 3Q05, compared with
a 43% YoY increase in entire 2004. Inventory levels are also growing quickly. A
survey by the PBOC of 5,000 industrial enterprises showed that inventory levels have risen by
17% YoY at the end of 2Q05. By contrast, imports of goods such as electronic components and
such items used for the onward processing of exports remain much stronger further reflecting
the economy’s continuing export orientation. Thus, imports of electronic integrated circuits and
microassemblies still rose by 32% YoY in 3Q05.

The increased export orientation of the Chinese economy explains why the government remains
so reluctant to allow a significant appreciation of the renminbi. But it also highlights the
vulnerability of China to a protectionist backlash should America slow sharply and the housing
market unwind. Our view on this is utterly simple. America’s commitment to free
markets and the like is firm only so long as the economy is growing at a respectable clip, say at
least over 2%. But any kind of real economic slowdown, most particularly if combined with a
downturn in housing, would cause politicians to move swiftly to reflect the mood of their
constituents. This is why it is interesting that the 2Q05 monetary policy report published by the
PBOC in August contained a highly relevant discussion on the need to promote domestic
consumption growth. This shows that the Chinese central bank is well aware of the issue. It is
also interesting that the central bank’s stress was on promoting domestic consumption in the
narrow sense, and not domestic demand in the more general sense which would include yet
more pump-priming investment.
one more note. while i was searching for "plutonomy" i came across links to fudan university and sichuan university, each of which offers masters programs in economics with a major in ...... plutonomy!
The tougher bankruptcy laws may please the puritans and there is some merit to penalising
profligacy. But they do risk a social backlash in a society where almost one fifth of the income
goes to 1% of the population (see Figure), most particularly as it will seem unfair to the
regular folk that companies are not treated the same way as individuals. Investors who live in
the real world, as opposed to academic textbooks, should take note. This point is particularly
relevant with research notes circulating globally about the likelihood of an ongoing global boom
as a consequence of the emergence of plutonomies where the growing wealth of the richest
parts of societies will continue to drive consumption.
US income shares by percentile size-classes, 2003

so i googled "plutonomy" and came across this:
U.S. resilient despite wealth gap
Friday, October 21, 2005; Posted: 7:27 a.m. EDT (11:27 GMT)
WASHINGTON (Reuters) -- It will be no consolation to poorer U.S. households struggling to make ends meet, but rising U.S. income disparity may explain how the world's biggest economy continues to expand rapidly amid repeated shocks.
For those puzzled at how the United States continues to grow well above historical averages despite blistering fuel price rises, rising debt and interest rates and ballooning national deficits, many economists say one answer lies in the American "plutonomy".
In a "plutonomy", according to Citigroup global strategist Ajay Kapur, economic growth is powered by and largely consumed by the wealthy few. Canada and Britain fall into that category too, he says, the euro zone and Japan much less so.
Spurred by capitalist-friendly governments, technology-driven productivity gains, high immigration and strict property rights and patents, Kapur argues the U.S. plutonomy has mushroomed since the early 1980s.
With huge chunks of national income and wealth increasingly concentrated in a tiny percentage of households at the top, national spending, profits and economic growth are disproportionately dependent on the fortunes of that same group.
And the more there is growth in the economy, profits and the price of assets, such as houses and equity, the relatively richer and more significant this group is in assessing nationwide growth.
In other words, calculating how higher energy costs will affect the economy by simply looking at the impact on 'average' American households can be hugely misleading.
"It is easy to drown in a lake with an 'average' depth of four feet - if one steps into the deeper extremes," Kapur wrote in report released this week.
"There is no average consumer in a 'plutonomy'," he said, adding: "Consensus analysis focusing on the average consumer are flawed from the start."
Impact
To be sure, hurricanes Katrina and Rita devastated the lives of millions of poor Americans. Many more now see household budgets squeezed to the limit by the ensuing surge in gasoline and home heating costs.
But the bald facts of rising inequality in America's wealth distribution means the trials of low- and even middle-income families will have only a small impact on gauges of gross domestic product, aggregate spending growth and corporate profits.
Kapur's report highlights consumer finance surveys showing the top one percent of U.S. households -- about 1 million households -- accounted for about 20 percent of overall U.S. income as recently as 2000.
That is only a slightly smaller share than the bottom 60 percent of some 60 million households put together.
And the top one percent also accounts for a third of household net worth, the difference between household assets -- such as equity or houses -- and debts. That is greater than the total held in the bottom 90 percent.
Economists say the decline in equity values since 2000 may have reduced the skew in this 2001 Survey of Consumer Finances, a triennial survey sponsored by the Federal Reserve. Data from the 2004 survey has yet to be released.
The rise in house prices since then will have distributed asset wealth a little wider than the concentration of equity.
But more recent household surveys ram home the point.
The 2003 Consumer Expenditure Survey shows pre-tax average income of the top quintile income group, at $127,146 per annum, just a thousand dollars short of the combined average income of all of the bottom 80 percent.
And it showed the average expenditure of the top 20 percent of households exceeded the total of the lowest 60 percent.
Dean Maki, Head of U.S. Economic Research at Barclays Capital, said spending by this top quintile seems very unlikely to drop substantially in response to higher energy prices.
Maki, co-author of a 2001 Fed study demonstrating the fall in the U.S. savings rate of rich Americans in response to the 1990s equity boom, said the top quintile are now seeing strong income growth, plentiful jobs and housing and equity gains.
"Energy prices represent a substantially smaller share of spending in these households than for poorer Americans," said Maki. "With fundamentals so positive for this group, we believe spending growth by the wealthy should continue to provide some insurance to the overall consumption outlook."
David Kelly, senior economic adviser at Putnam Investments in Boston, reckons debt among poorer households also play a significant part in keeping U.S. consumers seemingly spending beyond their means.
But Maki at Barclays pointed out that a large part of the nationwide debt too is held by the top income quintile and for that group, assets far outweigh debt holdings.
"That's one reason we don't see much of a relationship between aggregate debt burden and consumer spending," he said.
For all the implications of this idea -- and Kapur reckons it goes a long way to explaining the wider issues of global economic imbalances -- many feel the reality of the situation should be obvious too all.
"Whatever about the political system, the U.S. economy is not a democracy -- it doesn't count by heads, it counts by dollars," said Putnam's Kelly.
jk comment nov '05:
Inflation in the wealthy part of the economy - high end homes and Hamptons real estate continue to appreciate. Deflation in the less well-off economy -- lowered wages [as at Delphi and the bankrupt airlines] and rising health care costs, lay offs or pay cuts with higher heating bills. Lower standards of living and indentured servitude under the new bankruptcy law.
the piece that started me down this rabbit hole continued:
We understand all too clearly that the rich have been getting richer in recent years
as a result of free markets and globalisation. But it is highly dangerous to extrapolate blindly
such a trend going forward. The massive divergence in the distribution of income has only been
socially acceptable in recent years in Anglo Saxon societies because the less well off have been
able to go into debt on the back of inflated house values. If that phenomenon unwinds in any
sort of semi-nasty fashion, as is anticipated here, the social contract will be threatened. True,
the political genius of Karl Rove allowed Bush Jnr to get re-elected in a political context where
the average American has in recent years suffered negative real income growth. But in our
view that political Houdini act was also made possible by the consumer purchasing
power generated by home-equity extraction. Thus, net equity extraction financed by home
mortgages totalled US$600bn in 2004, amounting to almost 7% of total household disposable
income, up from US$204bn or 2.8% of disposable income in 2000, according to a recent Fed
research report co-authored by Alan Greenspan (Estimates of home mortgage originations,
repayments, and debt on one-to-four-family residences, September 2005).
The same point applies for political tolerance in America of the Chinese trade surplus. It is a
feature of the latest Chinese macro statistics that China is more geared into export growth than
at any time for the past 10 years. Thus, net exports of goods accounted for 5.3% of GDP in the
first nine months of this year, up from 1.9% in 2004. Furthermore, the increase
in net merchandise exports contributed to an estimated 41% of the nominal GDP growth for the
first three quarters of this year. This means China is more geared to the US economy, and
therefore to the US consumer, than ever before as reflected in the booming bilateral trade
surplus. Thus, China’s trade surplus with the US rose by 48% YoY in the first
nine months of this year to a record US$81.2bn. This has already exceeded the trade surplus
with the US recorded in the whole of 2004. Similarly, the statistical evidence also suggests that
[Chinese] domestic demand is slowing. Thus, the rate of growth of imports of machinery and equipment
is down dramatically. Imports of machine tools rose by only 3.6% YoY in 3Q05, compared with
a 43% YoY increase in entire 2004. Inventory levels are also growing quickly. A
survey by the PBOC of 5,000 industrial enterprises showed that inventory levels have risen by
17% YoY at the end of 2Q05. By contrast, imports of goods such as electronic components and
such items used for the onward processing of exports remain much stronger further reflecting
the economy’s continuing export orientation. Thus, imports of electronic integrated circuits and
microassemblies still rose by 32% YoY in 3Q05.

The increased export orientation of the Chinese economy explains why the government remains
so reluctant to allow a significant appreciation of the renminbi. But it also highlights the
vulnerability of China to a protectionist backlash should America slow sharply and the housing
market unwind. Our view on this is utterly simple. America’s commitment to free
markets and the like is firm only so long as the economy is growing at a respectable clip, say at
least over 2%. But any kind of real economic slowdown, most particularly if combined with a
downturn in housing, would cause politicians to move swiftly to reflect the mood of their
constituents. This is why it is interesting that the 2Q05 monetary policy report published by the
PBOC in August contained a highly relevant discussion on the need to promote domestic
consumption growth. This shows that the Chinese central bank is well aware of the issue. It is
also interesting that the central bank’s stress was on promoting domestic consumption in the
narrow sense, and not domestic demand in the more general sense which would include yet
more pump-priming investment.
one more note. while i was searching for "plutonomy" i came across links to fudan university and sichuan university, each of which offers masters programs in economics with a major in ...... plutonomy!


Comment