Announcement

Collapse
No announcement yet.

Fed Draining

Collapse
X
 
  • Filter
  • Time
  • Show
Clear All
new posts

  • Fed Draining

    I would welcome comments on the following commentary from Denninger at Market Ticker:

    http://market-ticker.denninger.net/
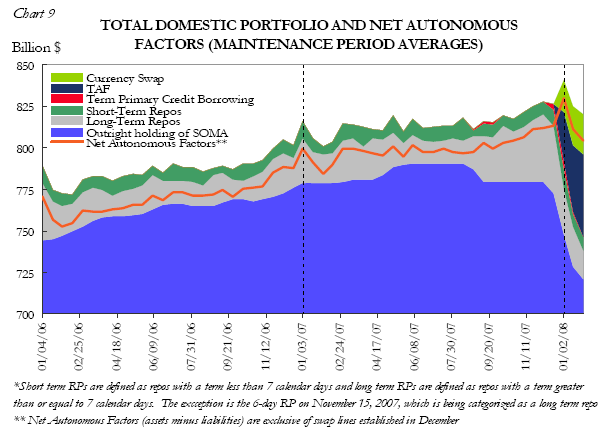


    The conclusions he draws are:

    This has profound investment implications.

    If you are investing today on the premise that "The Fed has our backs", you're wrong.
    If you are buying metals in the belief that The Fed is intentionally devaluing the dollar and hyperinflating the money supply, you're wrong.
    If you think The Fed is intentionally being "the bagholder of last resort", monetizing bad debt, you're wrong.
    If you think The Fed leads the market and sets rates, again, you're wrong. (Read the entire PDF - very carefully - you will find that The Fed is in fact following the market, and admits so!)
    There simply is no more debate on any of these points, because we now have the actual data from the Horse's Mouth.

    There are is no more "postulating" this or that, as we now have the facts, and they are what they are.

    There is no bailout in process via monetization. Period.
    There is no hyperinflation via "printing." Period.
    The Fed does not "set" interest rates. The market does, and The Fed then does their damndest to deal with it. Period.
    In fact, The Fed is actually taking down risk, as I have said repeatedly, and de-leveraging not only their own balance sheets but they are also forcibly taking down risk in the primary dealers - whether they like it or not!

    Now we know - for a fact - why Citibank had to go to the Arabs for money at double-digit rates. Why the other money-center banks are issuing preferreds and other instruments with returns at more than double the interest coupon required to borrow through the primary Fed credit facility (whether it be the TAF or the Discount Window.)

    We now know the facts of life:

    Fact: The good collateral has all been pledged.
    Fact: The margin credit supply has been decreased.
    Fact: Risk capacity is being withdrawn actively by The Fed.
    Fact: The money supply is deflating.
    Get that all in your head and make sure it sticks, because if it is not the foundation of your investment thesis over the next several months, you are proceeding from an incorrect premise.

    That doesn't sound like the itulip thesis to me.

  • #2
    Re: Fed Draining

    the decline in the chart is only very recent. The iTulip thesis would predict that we start another period of reflation...and who says we aren't or won't?

    Comment


    • #3
      Re: Fed Draining

      the tell will be the taf. if, as postulated, all the "good" collateral has been pledged, then any growth in the taf will represent the fed taking on shaky paper. if the taf grows significantly, the itulip thesis is right. if the taf doesn't grow, and there is no other program initiated by the fed to augment the taf, then we're wrong. i think....

      Comment


      • #4
        Re: Fed Draining

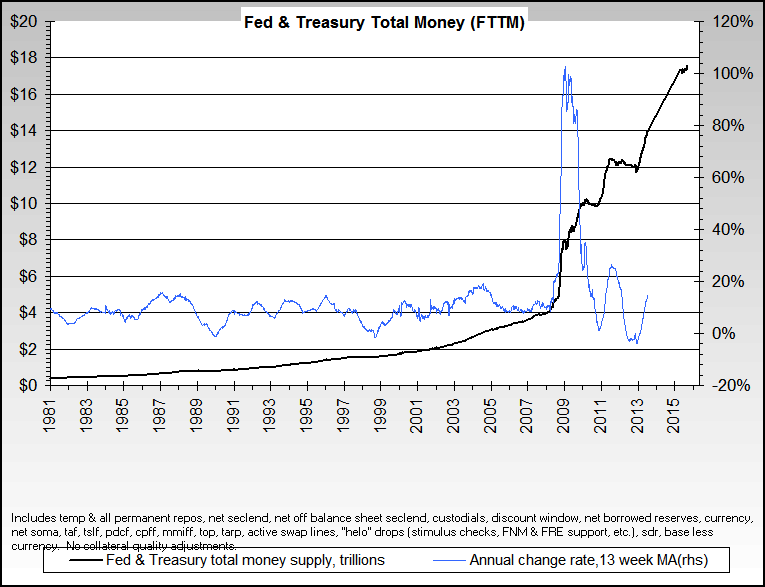
        I concur with Mr. Denninger. My own chart that attempts to track the entire set of Fed operations has been falling since late December on an annual rate of change basis. It is also still in a high range - around 9.5%.
        The thin red line is the important one and correlates well with the very fine work from Denninger. Note also that GSDS is roughly a picture of what the primary dealers of the Fed are doing in the Treasury & corporate bond and MBS and agency/GSE areas.


        The major issue that he does not address though is the concept of lags. The huge majority of Fed actions take many months to have an effect.
        http://www.NowAndTheFuture.com

        Comment


        • #5
          Re: Fed Draining

          Originally posted by oddlots View Post
          I would welcome comments on the following commentary from Denninger at Market Ticker:

          http://market-ticker.denninger.net/


          The conclusions he draws are:

          This has profound investment implications.

          If you are investing today on the premise that "The Fed has our backs", you're wrong.
          If you are buying metals in the belief that The Fed is intentionally devaluing the dollar and hyperinflating the money supply, you're wrong.
          If you think The Fed is intentionally being "the bagholder of last resort", monetizing bad debt, you're wrong.
          If you think The Fed leads the market and sets rates, again, you're wrong. (Read the entire PDF - very carefully - you will find that The Fed is in fact following the market, and admits so!)
          There simply is no more debate on any of these points, because we now have the actual data from the Horse's Mouth.

          There are is no more "postulating" this or that, as we now have the facts, and they are what they are.

          There is no bailout in process via monetization. Period.
          There is no hyperinflation via "printing." Period.
          The Fed does not "set" interest rates. The market does, and The Fed then does their damndest to deal with it. Period.
          In fact, The Fed is actually taking down risk, as I have said repeatedly, and de-leveraging not only their own balance sheets but they are also forcibly taking down risk in the primary dealers - whether they like it or not!

          Now we know - for a fact - why Citibank had to go to the Arabs for money at double-digit rates. Why the other money-center banks are issuing preferreds and other instruments with returns at more than double the interest coupon required to borrow through the primary Fed credit facility (whether it be the TAF or the Discount Window.)

          We now know the facts of life:

          Fact: The good collateral has all been pledged.
          Fact: The margin credit supply has been decreased.
          Fact: Risk capacity is being withdrawn actively by The Fed.
          Fact: The money supply is deflating.
          Get that all in your head and make sure it sticks, because if it is not the foundation of your investment thesis over the next several months, you are proceeding from an incorrect premise.

          That doesn't sound like the itulip thesis to me.
          All reports by Denninger (aka Genesis, the owner and operator of TickerForum) on events occurring within the banking system have to be viewed as intended to support his theory that the US money system is going to experience a massive deflation ala 1930s.

          His approach to the argument is: 1) develop theory, 2) repeat it over and over, 3) look for evidence to support it, 4) ignore all evidence that contradicts it, 5) use your authority as the site owner to browbeat or threaten to ban as "tin foil hat" anyone who disagrees, 6) goto step 2. You can see our arguments with him on TickerForum on the topic of inflation and deflation here and here.

          A few charts show anomalous activity within the reserve system and suddenly everyone is an expert in the inner workings of the banking system. He made similar statements previously about bank reserves here. Rich Toscano over at http://piggington.com takes an approach like ours. If we encounter something we don't understand we seek out an expert. Here's what a banking expert Davelj had to say about Denninger's (Genesis') analysis that time around:
          Yeah, basically this guy Genesis doesn't have a clue as to what he's talking about, which often happens when otherwise intelligent folks try to decipher the banking industry. As he kind of acknowledges at the beginning of his post: "Let me preface this by saying that I'm not at all certain I understand what I'm looking at here correctly." more...
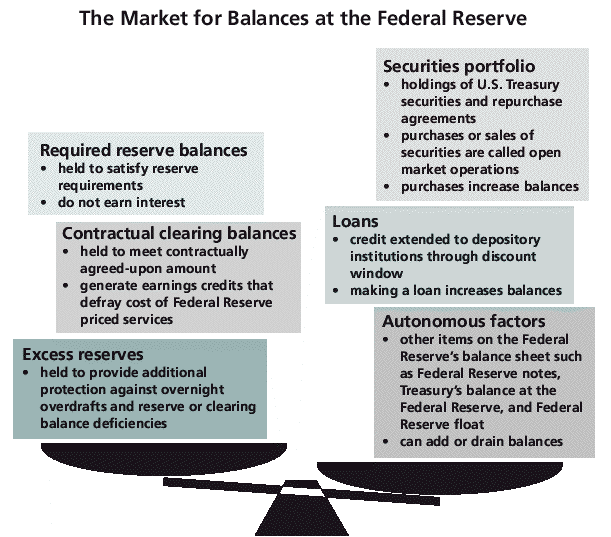
          Denninger probably doesn't know what he's talking about this time either. We don't pretend to be experts on the banking system, but the chart likely shows the Fed drawing down Securities portfolio, Loans, and Autonomous factors to re-balance accounts with Required reserves, Contractual Clearing Balances, and Excess reserves.


          This chart was extracted from this report that explains how the system works. You can read the entire report here in Section 3: Implementation of Monetary Policy (pdf).

          The Fed is highly transparent about how it manages payments, reserves and so on within the banking system. For example, the spike in Free or Borrowed Reserves that occurred around 9/11/01 shown in the chart below.


          The reasons for it are detailed in this Fed paper Payment System Disruptions and the Federal Reserve Following September 11, 2001 (pdf).
          Similarly, the dip in Free or Borrowed Reserves that occurred recently will no doubt be similarly demystified by the Fed. There is usually a reasonable explanation for these occurrences but one has to want to find out what's really going on, not first decide that "the Fed is draining money from the system" then use a creative analysis of a specific event to support the theory. Pretending to be an expert in banking, no matter how convincing, is not the same thing as being an actual banking expert, which is why we reach out to banking experts and more than one to get a range of expert opinion. Our and Piggington's approach is called "journalism" whereas the Mish/Denninger approach is "entertainment." Nothing wrong with that, so long as it isn't represented as actual journalism.

          The Fed may or may not be draining liquidity from the banking system but either way the chart that Denninger offers is irrelevant.
          Last edited by FRED; February 13, 2008, 01:37 PM. Reason: Fixed the broken link.
          Ed.

          Comment


          • #6
            Re: Fed Draining

            Thanks all for the comments. Regarding the last, I guess I should have guessed that there'd be history with Denninger given the endless 'flation debate... and re-read some stuff here before putting it up.

            Ironically I got pretty alarmed over the plummeting non-borrowed reserves via Mish, Denninger and some others until Caroline Baum, Greg Ip (in WSJ) and Piggington (http:piggington.cobank_reserve_requirements_and_t he_taf) schooled everyone on what it meant or didn't mean.

            Twice burnt.

            In the interests of actually making some progress in understanding what these charts do or don't demonstrate I am off to read "Section 3: Implementation of Monetary Policy" (Fred, the posted link doesn't work but have found it here: http://www.federalreserve.gov/pf/pf.htm.) Thanks for the reference.

            Comment


            • #7
              Re: Fed Draining

              In the interests of my own lethargy I will ask........
              On this chart "Currency Swaps" suddenly appear abut the same time as the TAF and are expanding in a similar way to the TAF. If anyone can tell me what this is and if it is of any significance, without needing to write a thesis, would they mind please.
              Cheers

              Comment


              • #8
                Re: Fed Draining

                I suppose also the massive increase in FHLB borrowings could be seen as a parallel reflation tool to the TAF even if it isn't done under the auspices of the Fed (and so does not appear in Denninger's stats):

                "Instead, the Fed found its liquidity operations bypassed as US commercial banks furtively accessed huge amounts of liquidity from the Federal Home Loan Banks. These wholesale government-sponsored bank co-operatives offered loans against housing-related collateral on an unprecedented scale, reaching an annualised rate of $750bn (£385bn, €517bn) during the third quarter of 2007, the last for which data is available."

                From: http://www.ft.com/cms/s/0/5d533184-d...0779fd2ac.html

                Comment


                • #9
                  Re: Fed Draining

                  Bart, I'm curious what you conclude, if anything, from your confirmation of the basic facts of the chart in the original post? i.e. do you know what it means?

                  Comment


                  • #10
                    Re: Fed Draining

                    OK In response to my own question....if I read the situation correctly...the Fed is trying to support the dollar artificially with these Currency swaps while trying to lower interest rates. Again if I read this correctly, the tricky part comes in a few months when the swaps must be redeemed. Yep! We could create yet another fed Ponzi scheme by rolling these things over in ever-increasing amounts..but for how long will other CB's tolerate this?

                    Or am I totally on the wrong track?

                    Comment


                    • #11
                      Re: Fed Draining

                      Originally posted by oddlots View Post
                      I suppose also the massive increase in FHLB borrowings could be seen as a parallel reflation tool to the TAF even if it isn't done under the auspices of the Fed (and so does not appear in Denninger's stats):

                      "Instead, the Fed found its liquidity operations bypassed as US commercial banks furtively accessed huge amounts of liquidity from the Federal Home Loan Banks. These wholesale government-sponsored bank co-operatives offered loans against housing-related collateral on an unprecedented scale, reaching an annualised rate of $750bn (£385bn, €517bn) during the third quarter of 2007, the last for which data is available."

                      From: http://www.ft.com/cms/s/0/5d533184-d...0779fd2ac.html
                      I believe Countrywide drew many billions on this before BofA bought it. I suppose this was intentional. We can expect a lot of this.

                      Comment


                      • #12
                        Re: Fed Draining

                        Originally posted by WDCRob View Post
                        Bart, I'm curious what you conclude, if anything, from your confirmation of the basic facts of the chart in the original post? i.e. do you know what it means?
                        The simplest explanation is what it shows - the total annual rate of change in all Fed actions is trending down, which is disinflationary, but its still at a high level of about 8%.

                        As Fred noted, that chart has true data and it is confirmed by mine, but it also fails to put *all* the data in perspective and makes the situation look significantly worse than it is in my opinion.

                        There are probably 25-50 charts on my site that try to put a full picture of money supply and the Fed out there (and the chart I posted is one of the better ones), but its virtually impossible to put it all in just a few charts. Its just plain way too complex, even before we get into tinfoil hat or behind the scenes elements.
                        http://www.NowAndTheFuture.com

                        Comment

                        Working...
                        X