Announcement

Collapse
No announcement yet.

What's with Bernanke jawboning the stock market upwards?

Collapse
X
 
  • Filter
  • Time
  • Show
Clear All
new posts

  • #61
    The Finster Dollar Index and the Ka-Poom Theory.

    Finster,

    Originally posted by Finster in post #42
    These charts and series can be formatted for any time interval, but the underlying resolution is weekly. In the charts you see here, the interval is in sixteenths of a year.
    Does "underlying resolution is weekly" mean the data points are entered just weekly?

    In looking at the three basic charts you posted in #39, it appears the x-axis ticks represent quarters of the year, so is "the interval is in sixteenths of a year" a typo or am I missing something? I do not know that this is at all important, but it serves to confuse me.


    In your above image from post #39, when the rates of change are moving downward, greater inflation is occurring, when they move upward, disinflation is occurring until upward moves cross zero (is it possible to put a line in the graph that denotes zero?), at which time further upward movement represents deflation. This applies to both the CPI and FDI data--please correct me if this is wrong. You know I didn't figure any of this out, but I think I am correctly recapitulating what you have explained somewhere above.

    Since about 12/03, the trend of the FDI is up (meaning disinflation) and the trend of the CPI is down (meaning increasing inflation). I assume you would agree with that.

    A lot of what is written (everywhere) recently entirely focuses on worsening inflation, and what is going to happen to it--you know the arguments better than I. BUT, your FDI indicates disinflation, and as far as I can tell, no one (or very few) is talking about disinflation now.
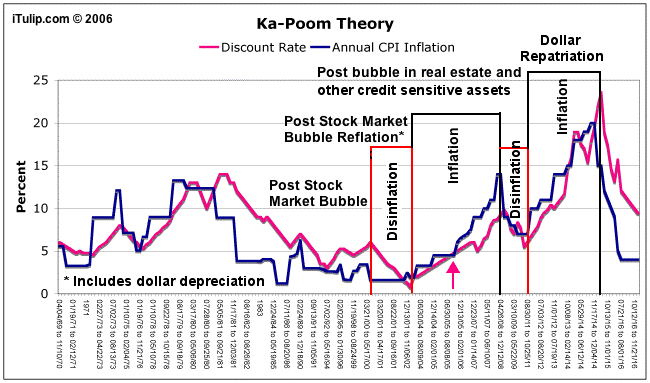


    In trying to tie what your FDI is showing, with what EJ's Ka-Poom theory may be predicting, though he is using CPI percentage to reflect inflation, it is possible that if your FDI data were converted into percentage values (and I expect you could do that, but I surely cannot), might they approach the number of about 12% as shown in the first "Inflation" box in the Ka-Poom graph?

    Further, do you, EJ, or anyone else care to expound on where we really may be right now regarding inflation, disinflation, and deflation, and what it portends?

    It is hard to me to write this, I hope you understand what I am asking?

    Let me throw in to blazespinnaker whose question started this thread, it was a good question, blaze.
    Jim 69 y/o

    "...Texans...the lowest form of white man there is." Robert Duvall, as Al Sieber, in "Geronimo." (see "Location" for examples.)

    Dedicated to the idea that all people deserve a chance for a healthy productive life. B&M Gates Fdn.

    Good judgement comes from experience; experience comes from bad judgement. Unknown.

    Comment


    • #62
      Re: What's with Bernanke jawboning the stock market upwards?

      Originally posted by jk
      the economist magazine has been posting a big mac index for years. it's a standardized item that allows direct comparison of purchasing power. it's actually not a bad index.
      might our non US members find a big mac index US centric? anyone plotted the big mac index against the dollar, gold or silver?

      Comment


      • #63
        Re: What's with Bernanke jawboning the stock market upwards?

        Originally posted by bart
        The FDI and his approach certainly isn't exactly inside the "normal" box - and its a (usually pleasant) stretch for most to understand what he's doing.
        A number of my non public charts do use the FDI, both as sidechecks to my own work and also because there's nothing else like it for leveling the field on a world wide basis. In other words, me too on his site update.
        It is not now so perplexing to me not to know what goes into the FDI; however, not knowing exactly what it uses to determine its value leaves me with some sort of void in my thinking--but prior to joining iTulip there were greater voids I did not even begin to appreciate--I have at least become more aware of some of my ignorance.

        Granting to Finster that what he has derived would be of the value it seems were its methodolgy subjected to scrutiny by his peers (of which I am not one), then despite that lack, its relative importance to me is still the apparent perspective into which it places the USD. One could manipulate the CPI to reveal a similar de-valuation of the dollar, but in my small world it never occurred to me to do it, plus the CPI lags so much.

        My concept for too long in thinking about inflation has been, as pointed out by Finster, to interpret inflation as rising prices of stuff vs. what more factually has been the decreasing value of the dollar. The people in government at not exactly idiots when it comes to arriving at methods by which to fool most of the people most of the time.
        Jim 69 y/o

        "...Texans...the lowest form of white man there is." Robert Duvall, as Al Sieber, in "Geronimo." (see "Location" for examples.)

        Dedicated to the idea that all people deserve a chance for a healthy productive life. B&M Gates Fdn.

        Good judgement comes from experience; experience comes from bad judgement. Unknown.

        Comment


        • #64
          Re: What's with Bernanke jawboning the stock market upwards?

          Originally posted by Jim Nickerson
          It is not now so perplexing to me not to know what goes into the FDI; however, not knowing exactly what it uses to determine its value leaves me with some sort of void in my thinking--but prior to joining iTulip there were greater voids I did not even begin to appreciate--I have at least become more aware of some of my ignorance.

          Granting to Finster that what he has derived would be of the value it seems were its methodolgy subjected to scrutiny by his peers (of which I am not one), then despite that lack, its relative importance to me is still the apparent perspective into which it places the USD. One could manipulate the CPI to reveal a similar de-valuation of the dollar, but in my small world it never occurred to me to do it, plus the CPI lags so much.

          My concept for too long in thinking about inflation has been, as pointed out by Finster, to interpret inflation as rising prices of stuff vs. what more factually has been the decreasing value of the dollar. The people in government at not exactly idiots when it comes to arriving at methods by which to fool most of the people most of the time.


          Very well put Jim, and I suspect your comments resonate well with many others as well as myself - especially the part about becoming more aware of my ignorance over the last three years or so. I always suspected there was much I didn't know and that there were many curtains and much BS extant... but the amount of them and all the "tricks" are still somewhat astounding to me... and have had a direct result on my general tinfoil hat mentality.
          My real opinions are not printable in a public forum - the scum behind the scenes and machinations they do make four letter words too mild.

          As far as what is in the FDI, I think I have a pretty good handle on it from being part of the threads a few years ago where Finster, I and others were discussing the basic issue of there being no standard against which to measure financial stuff. Without getting into that detail, the elements are basically very broad public measures of major sectors and "economics" as Finster notes on his site... and while they may not be the very best possible selections or totally complete, they unquestionably beat anything else out there to the best of my knowledge.
          It wouldn't surprise me if Finster does do that submission to a peer group in the future - I sure hope so too. It deserves much broader distribution.


          As you probably have gathered, the lagging characteristic of the CPI is what prompted me to put together my inflation prediction chart... and of course, to have "battle of the charts" moments with Finster and others... ;)
          http://www.NowAndTheFuture.com

          Comment


          • #65
            Re: What's with Bernanke jawboning the stock market upwards?

            Originally posted by metalman
            might our non US members find a big mac index US centric? anyone plotted the big mac index against the dollar, gold or silver?
            the big mac index reports the price of a mac in the many countries in which they are available. this is not u.s. centric except in the sense that the big mac originated in the u.s. bart has said he has charts of its history, presumably in multiple currencies. so perhaps bart knows the answer about the mac against the dollar, gold and silver. [? bart]

            Comment


            • #66
              Re: the fdi v the cpi- question for finster

              finster, i have a question for you, as much to check my understanding of your index, but also to get an answer.

              looking at the plot of the roc fdi and roc cpi and their different movements in recent months, it looks like the fdi is pointing to disinflation while the cpi points to inflation. but the different composition of the indices explains this. fdi, if i understand you correctly, includes asset prices such as equities, houses, and so on. if this is the case, bear markets in equities and housing shows up as disinflation or deflation in the fdi. cpi, supposedly, reflects living expenses [and not assets].

              one implication has to do with the value of holding cash, or near cash [e.g. 3-6mo tbills]. the path of the fdi says holding cash is increasingly attractive, as that cash will buy increasing amounts of equities, housing, and other assets. the path of the cpi implies that cash is deteriorating in value relative to everyday, everyweek, everymonth expenses. if the fdi is indeed more inclusive, it would be the important index to pay attention to when making the decision to hold cash. is this a correct interpretation?

              Comment


              • #67
                Re: The Finster Dollar Index and the Ka-Poom Theory.

                Originally posted by Jim Nickerson
                Does "underlying resolution is weekly" mean the data points are entered just weekly?
                It means that both the input and output data have a maximum accuracy of weekly. In other words, the data points going into the algorithm are weekly, and (regardless of the frequency displayed on the chart) the precision of the output is no more than weekly.

                Originally posted by Jim Nickerson
                In looking at the three basic charts you posted in #39, it appears the x-axis ticks represent quarters of the year, so is "the interval is in sixteenths of a year" a typo or am I missing something? I do not know that this is at all important, but it serves to confuse me.
                The actual data points on the chart are sixteen per year. There are four data points between axis tick marks, and four tick marks between axis numerals.

                Originally posted by Jim Nickerson
                In your above image from post #39, when the rates of change are moving downward, greater inflation is occurring, when they move upward, disinflation is occurring until upward moves cross zero (is it possible to put a line in the graph that denotes zero?), at which time further upward movement represents deflation. This applies to both the CPI and FDI data--please correct me if this is wrong. You know I didn't figure any of this out, but I think I am correctly recapitulating what you have explained somewhere above.
                Just about it, Jim. On the ROC chart, the level of the graph is the rate of inflation, and a horizontal line would represent a constant rate of inflation or deflation. The term "disinflation" applies to a changing (decreasing) rate of inflation, so is shown as an upsloping line. In the language of mathematics, the terms "inflation" and "deflation" occur at the first derivative (rate of change) of the value of the currency. The term "disinflation" occurs at the second derivative (rate of change of rate of change) of the value of the currency (the first derivative of the rate of inflation or deflation).

                These relationships are just like those between the position of a car, the velocity of the car, and the acceleration (rate of change of velocity) of the car.

                I hope that in the pursuit of complete accuracy that was not too confusing…

                Originally posted by Jim Nickerson
                Since about 12/03, the trend of the FDI is up (meaning disinflation) and the trend of the CPI is down (meaning increasing inflation). I assume you would agree with that.

                A lot of what is written (everywhere) recently entirely focuses on worsening inflation, and what is going to happen to it--you know the arguments better than I. BUT, your FDI indicates disinflation, and as far as I can tell, no one (or very few) is talking about disinflation now.
                Exactly. Technically any period in which the FDI ROC is positive and rising would represent disinflation. On the other hand, if it’s only for a week, for example, you may not consider the trend sustained enough to apply the term. This is at least partly because conventional indices are so slow to respond. In fact, consumer prices themselves respond only gradually to changes in inflation. This is partly due to the fact that store owners don’t ordinarily change advertised prices that often, and even more due to wages responding even more sluggishly. Think of union contracts, etceteras. Usually in the early stages of deflation the labor market, the first sign is a rise in the unemployment rate, as real wages rise and become artificially high. This creates a labor surplus - AKA unemployment. So unless deflation is particularly deep or long lasting, it is not widely recognized as such. The first signals tend to occur in markets in which prices are set in real time - such as in financial markets - and only later appear in labor and consumer markets.

                Originally posted by Jim Nickerson
                In trying to tie what your FDI is showing, with what EJ's Ka-Poom theory may be predicting, though he is using CPI percentage to reflect inflation, it is possible that if your FDI data were converted into percentage values (and I expect you could do that, but I surely cannot), might they approach the number of about 12% as shown in the first "Inflation" box in the Ka-Poom graph?
                The FDI ROC chart is what you have in mind. A value of 0.02, for example basically corresponds to a 2% rate.

                Originally posted by Jim Nickerson
                Further, do you, EJ, or anyone else care to expound on where we really may be right now regarding inflation, disinflation, and deflation, and what it portends?
                So far in this discussion I haven’t ventured a forecast. The FDI itself is not predictive, it only appears that way compared to the much-more-sluggish CPI. EJ’s Ka-Poom chart, on the other hand, does outline a forecast. My view is that the evolution along that time line is likely to be somewhat faster than the chart portrays, but that’s a relatively minor issue. If that is right, the FDI is on the cusp of an upturn not unlike those seen in 1997-1998 and 2000-2002. And if so, that is probably what the recent upturn in the bond market (declining rates) is confirming. But there have been fake-outs before. It is very difficult to assess.
                Finster
                ...

                Comment


                • #68
                  Re: What's with Bernanke jawboning the stock market upwards?

                  Originally posted by bart
                  and have had a direct result on my general tinfoil hat mentality.
                  My real opinions are not printable in a public forum - the scum behind the scenes and machinations they do make four letter words too mild. ;)
                  I will admit to being as dense as anyone who visits iTulip, but FINALLY I hope I comprehend the significance in your avatar of the protective tinfoil shield on your head--it is to protect your thoughts from invasion by crap.

                  Speaking of four letter words, when I was in Viet Nam 39 years ago, I was at a field hospital and shared a hooch with an orthopedic surgeon who related one evening the answer a young wounded Marine he was treating gave when asked what he thought of the Viet Cong. The Marine answered, "F?ck the f?cking f?ckers." So it is possible to be seriously derogatory, succinct, and with only the minimal use (1 of 4 words) of four letter words. It also demonstrates the versatility of some words in our English such that a single root can be used as a verb, adjective, and noun.
                  Last edited by Jim Nickerson; August 20, 2006, 03:25 PM.
                  Jim 69 y/o

                  "...Texans...the lowest form of white man there is." Robert Duvall, as Al Sieber, in "Geronimo." (see "Location" for examples.)

                  Dedicated to the idea that all people deserve a chance for a healthy productive life. B&M Gates Fdn.

                  Good judgement comes from experience; experience comes from bad judgement. Unknown.

                  Comment


                  • #69
                    Re: What's with Bernanke jawboning the stock market upwards?

                    Originally posted by Jim Nickerson
                    I will admit to being as dense as anyone who visits iTulip, but FINALLY I hope I comprehend the significance in your avatar of the protective tinfoil shield on your head--it is to protect your thoughts from invasion by crap.
                    Indeed - and I recently added a silver lining to it... ;)


                    Originally posted by Jim Nickerson
                    Speaking of four letter words, when I was in Viet Nam 39 years ago, I was at a field hospital and shared a hooch with an orthopedic surgeon who related one evening the answer a young wounded Marine he was treating gave when asked what he thought of the Viet Cong. The Marine answered, "F?ck the f?cking f?ckers." So it is possible to be seriously derogatory, succinct, and with only the minimal use (1 of 4 words) of four letter words. It also demonstrates the versatility of some words in our English such that a single root can be used as a verb, adjective, and noun.
                    Pure artistry, I love it!
                    http://www.NowAndTheFuture.com

                    Comment


                    • #70
                      Re: What's with Bernanke jawboning the stock market upwards?

                      Originally posted by jk
                      the big mac index reports the price of a mac in the many countries in which they are available. this is not u.s. centric except in the sense that the big mac originated in the u.s. bart has said he has charts of its history, presumably in multiple currencies. so perhaps bart knows the answer about the mac against the dollar, gold and silver. [? bart]
                      I'm honestly not sure how to answer. The index itself shows what boils down to purchasing power parity comparisons between currencies so any chart comparison with gold & silver would be all over the place depending on what currency was being viewed and during what time period.

                      There's a chart that Kitco does that shows gold in various currencies which would probably be much better - look for "Live currency charts and charts comparing $USD gold to all major currencies." towards the bottom of the page.

                      There's also a very cool facility at stockcharts and one can key in $GOLD:$USD (gold/dollar) and $GOLD:$XJY (gold/yen) and $GOLD:$XEU (gold/euro) etc etc and use the slider to view it over a varying period.
                      Here's a link that shows gold with a number of different world stock markets:
                      Comparison chart
                      http://www.NowAndTheFuture.com

                      Comment


                      • #71
                        Re: The Finster Dollar Index and the Ka-Poom Theory.

                        Originally posted by Finster
                        It means that both the input and output data have a maximum accuracy of weekly. In other words, the data points going into the algorithm are weekly, and (regardless of the frequency displayed on the chart) the precision of the output is no more than weekly.
                        I've got it now.

                        Originally posted by Finster
                        The actual data points on the chart are sixteen per year. There are four data points between axis tick marks, and four tick marks between axis numerals.
                        I understand.

                        Originally posted by Finster
                        Just about it, Jim. On the ROC chart, the level of the graph is the rate of inflation, and a horizontal line would represent a constant rate of inflation or deflation. The term "disinflation" applies to a changing (decreasing) rate of inflation, so is shown as an upsloping line. In the language of mathematics, the terms "inflation" and "deflation" occur at the first derivative (rate of change) of the value of the currency. The term "disinflation" occurs at the second derivative (rate of change of rate of change) of the value of the currency (the first derivative of the rate of inflation or deflation).

                        These relationships are just like those between the position of a car, the velocity of the car, and the acceleration (rate of change of velocity) of the car.

                        I hope that in the pursuit of complete accuracy that was not too confusing…
                        I finally got the meaning of the left axis as being percentage--it will be a better graph, when you get to it, to label that as " - %" for those who may be like me and have to be led each step down the path. I'll have to think about the rest in this paragraph--which as long as it is accurate certainly suffices. The info is there, all I have to do is grasp it.

                        Originally posted by Finster
                        The FDI ROC chart is what you have in mind. A value of 0.02, for example basically corresponds to a 2% rate.
                        So I was accidentally near correct in saying that inflation as reflected by the FDI might be approaching what EJ had theorized as rising to 12%, I think his graph more closely might reflect 14% (the right side of the first black rectangle in Ka-Poom graph). I realized the red numbers in the ROC were negative, but I didn't readily extrapolate them to representing the inflation rate in positive numbers. Finster, you know this, but for anyone else caring to read this stuff, your ROC chart is perhaps superb, and I think you are due a lot of credit for coming up with it and of thanks, at least from me, for sharing your work on these fora.

                        Originally posted by Finster
                        So far in this discussion I haven’t ventured a forecast. The FDI itself is not predictive, it only appears that way compared to the much-more-sluggish CPI. EJ’s Ka-Poom chart, on the other hand, does outline a forecast.
                        There is some conflict in my mind about using the word "predictive" in reference to the FDI. If the FDI is in fact what you have tried to work it out to be, then hopefully what it is telling us is "truth," and if it is, then later the CPI (if it isn't manipulated too much) with its lag in being reported or lag in picking up inflation or deflation may also in a month or six or so show the same thing. Right now it is not showing the same thing. FDI now=disinflationary movement, CPI now=inflationary movement, and as you said, this is due to the lag factors in how price changes move through the CPI and how with regard to timing the CPI is reported.

                        Originally posted by Finster
                        My view is that the evolution along that time line is likely to be somewhat faster than the chart portrays, but that’s a relatively minor issue.
                        Well, if FDI is correct, we are further along no doubt on EJ's time horizon than the CPI suggests, but then I presume his picking 14% before disinflation set in, though well thought out, might be off one way or the other. To me the notion of when disinflation sets in is not minor if such a disinflationary period presages similar equity market collapses as occurred from July to October 1998, and 2000 to October 2002.

                        Originally posted by Finster
                        If that is right, the FDI is on the cusp of an upturn not unlike those seen in 1997-1998 and 2000-2002. And if so, that is probably what the recent upturn in the bond market (declining rates) is confirming. But there have been fake-outs before. It is very difficult to assess.
                        Good enough. Whether or not you are right with the FDI, this intercourse has broadened my thinking.
                        Last edited by Jim Nickerson; August 20, 2006, 08:38 PM.
                        Jim 69 y/o

                        "...Texans...the lowest form of white man there is." Robert Duvall, as Al Sieber, in "Geronimo." (see "Location" for examples.)

                        Dedicated to the idea that all people deserve a chance for a healthy productive life. B&M Gates Fdn.

                        Good judgement comes from experience; experience comes from bad judgement. Unknown.

                        Comment


                        • #72
                          Re: The Finster Dollar Index and the Ka-Poom Theory.

                          Originally posted by Jim Nickerson
                          Well, if FDI is correct, we are further along no doubt on EJ's time horizon than the CPI suggests, but then I presume his picking 14% before disinflation set is, though well thought out, might be off one way or the other. To me the notion of when disinflation sets in is not minor if such a disinflationary period presages similar equity market collapses as occurred from July to October 1998, and 2000 to October 2002.
                          I should have mentioned this earlier, but probably the closest precedent for where we are now is the contertrend deflationary spell we had in the midst of the 1970's inflation. Indeed, I look at this as highly analogous to the upcoming "Ka" on EJ's chart. You can see this as the rise in the FDI that occured in the middle of the 1970's.
                          Finster
                          ...

                          Comment


                          • #73
                            Re: the fdi v the cpi- question for finster

                            Originally posted by jk
                            finster, i have a question for you, as much to check my understanding of your index, but also to get an answer.

                            looking at the plot of the roc fdi and roc cpi and their different movements in recent months, it looks like the fdi is pointing to disinflation while the cpi points to inflation. but the different composition of the indices explains this. fdi, if i understand you correctly, includes asset prices such as equities, houses, and so on. if this is the case, bear markets in equities and housing shows up as disinflation or deflation in the fdi. cpi, supposedly, reflects living expenses [and not assets].

                            one implication has to do with the value of holding cash, or near cash [e.g. 3-6mo tbills]. the path of the fdi says holding cash is increasingly attractive, as that cash will buy increasing amounts of equities, housing, and other assets. the path of the cpi implies that cash is deteriorating in value relative to everyday, everyweek, everymonth expenses. if the fdi is indeed more inclusive, it would be the important index to pay attention to when making the decision to hold cash. is this a correct interpretation?
                            Bull's eye, JK. Due to the inclusion in the FDI of prices that respond more quickly to changes in the money supply and value of the currency, it tends to lead the CPI. In addition, it avoids the inflation understatement bias in the CPI due to the use of such statistical ledgerdemain as "homeowner's equivalent rent", substitution bias, quality hedonics, etceteras. Uptrends in the FDI would correspond periods in which ideally you'd overweight cash.
                            Finster
                            ...

                            Comment


                            • #74
                              Re: What's with Bernanke jawboning the stock market upwards?

                              Originally posted by bart
                              I couldn't agree more. The FDI and his approach certainly isn't exactly inside the "normal" box - and its a (usually pleasant) stretch for most to understand what he's doing. My comment on regret was very much intended as a tongue in cheek comment too, as I think you know.

                              A number of my non public charts do use the FDI, both as sidechecks to my own work and also because there's nothing else like it for leveling the field on a world wide basis. In other words, me too on his site update.
                              Been getting sidetracked on that site update; doesn't help that I'm no HTML whiz. If I don't get to it this week, though, I'll upload a full data update. I wonder how your m3b would compare. I wouldn’t expect good short-term correlations, but in the months-to-years time frames there may be something (with an appropriate lag) worth investigating. It wouldn't necessarily have to be m3b, but whatever money measure or derivative you look at as most indicative of nascent inflation.
                              Finster
                              ...

                              Comment


                              • #75
                                Re: What's with Bernanke jawboning the stock market upwards?

                                Originally posted by Finster
                                I wonder how your m3b would compare. I wouldn’t expect good short-term correlations, but in the months-to-years time frames there may be something (with an appropriate lag) worth investigating. It wouldn't necessarily have to be m3b, but whatever money measure or derivative you look at as most indicative of nascent inflation.
                                M3/M3b is probably as good as any single Fed stat although repos might be a bit better.

                                An Excel sheet is available inside a zip at m3b.zip - I'm honestly not sure what you're looking at. By context, it seems you're looking at a possible correlation between M3 and the FDI? If so, perhaps my CPI predict data would work better?
                                http://www.NowAndTheFuture.com

                                Comment

                                Working...
                                X