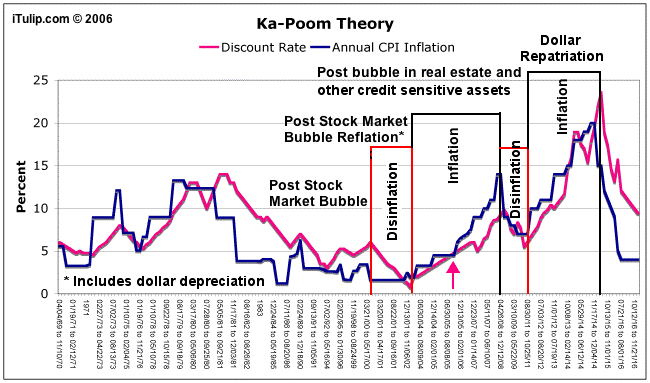
The Finster Dollar Index and the Ka-Poom Theory.
Finster,
Does "underlying resolution is weekly" mean the data points are entered just weekly?
In looking at the three basic charts you posted in #39, it appears the x-axis ticks represent quarters of the year, so is "the interval is in sixteenths of a year" a typo or am I missing something? I do not know that this is at all important, but it serves to confuse me.

In your above image from post #39, when the rates of change are moving downward, greater inflation is occurring, when they move upward, disinflation is occurring until upward moves cross zero (is it possible to put a line in the graph that denotes zero?), at which time further upward movement represents deflation. This applies to both the CPI and FDI data--please correct me if this is wrong. You know I didn't figure any of this out, but I think I am correctly recapitulating what you have explained somewhere above.
Since about 12/03, the trend of the FDI is up (meaning disinflation) and the trend of the CPI is down (meaning increasing inflation). I assume you would agree with that.
A lot of what is written (everywhere) recently entirely focuses on worsening inflation, and what is going to happen to it--you know the arguments better than I. BUT, your FDI indicates disinflation, and as far as I can tell, no one (or very few) is talking about disinflation now.

In trying to tie what your FDI is showing, with what EJ's Ka-Poom theory may be predicting, though he is using CPI percentage to reflect inflation, it is possible that if your FDI data were converted into percentage values (and I expect you could do that, but I surely cannot), might they approach the number of about 12% as shown in the first "Inflation" box in the Ka-Poom graph?
Further, do you, EJ, or anyone else care to expound on where we really may be right now regarding inflation, disinflation, and deflation, and what it portends?
It is hard to me to write this, I hope you understand what I am asking?
Let me throw in to blazespinnaker whose question started this thread, it was a good question, blaze.
Finster,
Originally posted by Finster in post #42
In looking at the three basic charts you posted in #39, it appears the x-axis ticks represent quarters of the year, so is "the interval is in sixteenths of a year" a typo or am I missing something? I do not know that this is at all important, but it serves to confuse me.

In your above image from post #39, when the rates of change are moving downward, greater inflation is occurring, when they move upward, disinflation is occurring until upward moves cross zero (is it possible to put a line in the graph that denotes zero?), at which time further upward movement represents deflation. This applies to both the CPI and FDI data--please correct me if this is wrong. You know I didn't figure any of this out, but I think I am correctly recapitulating what you have explained somewhere above.
Since about 12/03, the trend of the FDI is up (meaning disinflation) and the trend of the CPI is down (meaning increasing inflation). I assume you would agree with that.
A lot of what is written (everywhere) recently entirely focuses on worsening inflation, and what is going to happen to it--you know the arguments better than I. BUT, your FDI indicates disinflation, and as far as I can tell, no one (or very few) is talking about disinflation now.

In trying to tie what your FDI is showing, with what EJ's Ka-Poom theory may be predicting, though he is using CPI percentage to reflect inflation, it is possible that if your FDI data were converted into percentage values (and I expect you could do that, but I surely cannot), might they approach the number of about 12% as shown in the first "Inflation" box in the Ka-Poom graph?
Further, do you, EJ, or anyone else care to expound on where we really may be right now regarding inflation, disinflation, and deflation, and what it portends?
It is hard to me to write this, I hope you understand what I am asking?
Let me throw in to blazespinnaker whose question started this thread, it was a good question, blaze.

Comment