Announcement

Collapse
No announcement yet.

What's with Bernanke jawboning the stock market upwards?

Collapse
X
 
  • Filter
  • Time
  • Show
Clear All
new posts

  • #46
    Re: What's with Bernanke jawboning the stock market upwards?

    Originally posted by Jim Nickerson
    I hope you will put all three of your charts on your website...
    I'll second that, would love to link to them once your redesign is done.
    http://www.NowAndTheFuture.com

    Comment


    • #47
      Re: issue of inflation as depicted by Finster's USD chart.

      Originally posted by Jim Nickerson
      ...
      Please know I realize I may be unrelenting in making requests of you, but could put whatever you think is the most representative equity index into these graphs and note it on the right y-axis, Finster, I would personally love that, and I expect other would grow to it also.
      We may be pushing the limits of my charting ability (that's Bart's bailiwick!;-), but perhaps this will do for now. This is the S&P 500 plotted along with the FDI and CPI per the first chart above. Since I had to log and compress it to fit properly, I put in a few legends to denote actual index values.

      Last edited by Finster; August 18, 2006, 03:02 PM.
      Finster
      ...

      Comment


      • #48
        Re: What's with Bernanke jawboning the stock market upwards?

        Originally posted by Jim Nickerson
        I hope you will put all three of your charts on your website, at the moment the ROC chart seems most timely, or certainly the one that can give the most information about what seems to be occurring most recently. For what it is worth, I think the way you have the lines moving is best--as you no doubt did when you chose the axis orientation. Down is bad for the dollar, and thanks for clarifing to me--though it was plain in your earlier posts--that the left scale is log changes and not the value of the USD.
        Appreciate the feedback, Jim, it will be helpful when I do the web site overhaul.
        Finster
        ...

        Comment


        • #49
          Re: issue of inflation as depicted by Finster's USD chart.

          Originally posted by Finster
          We may be pushing the limits of my charting ability (that's Bart's bailiwick!;-), but perhaps this will do for now. This is the S&P 500 plotted along with the FDI and CPI per the first chart above. Since I had to log and compress it to fit properly, I put in a few legends to denote actual index values.

          Damned, you are a good man, Finster. I think this is the first chart that I have seen--or at least remember seeing--that best dipicts the relationship of deflationary periods to an equity index. Also, not being anything close to an Excel expert with charting, I appreciate a bit with what you are dealing to produce these charts--IT IS THE PICTURE OF WHAT I HAVE I WANTED TO SEE FOR A LONG TIME--what more can I say?

          Now, I believe, someway if EJ could agree that what appears great to me is in fact great, then possibly he could incorporate your FDI (blue line) and the SPX into his Ka-Poom chart. I do not have an idea as to what he might do with projections from present forward with regard to FDI and SPX, as he has projected inflation on his last update in the Ka-Poom chart. It would be appropriate to me if he just would leave the FDI and SPX to where they are now. His Ka-Poom chart only has two data charted, both in percent. To utilize the FDI, someway it would have to be converted to percent--I presume that could be done. For my liking EJ's Ka-Poom chart would be more meaningful if it as least had an equity index on its right scale to now. Just one man's ideas.
          Jim 69 y/o

          "...Texans...the lowest form of white man there is." Robert Duvall, as Al Sieber, in "Geronimo." (see "Location" for examples.)

          Dedicated to the idea that all people deserve a chance for a healthy productive life. B&M Gates Fdn.

          Good judgement comes from experience; experience comes from bad judgement. Unknown.

          Comment


          • #50
            Re: issue of inflation as depicted by Finster's USD chart.

            Originally posted by Finster
            We may be pushing the limits of my charting ability (that's Bart's bailiwick!;-), but perhaps this will do for now. This is the S&P 500 plotted along with the FDI and CPI per the first chart above. Since I had to log and compress it to fit properly, I put in a few legends to denote actual index values.
            I hope this doesn't come across as pandering but that chart isn't even something I'd attempt. Excel is quite poor at log charts - a double doff of the chapeau to you for pulling it off.

            One of these days I'll install Excel 2007 beta in a separate virtual machine and see if it improves on the log chart capability.
            http://www.NowAndTheFuture.com

            Comment


            • #51
              the s&p and the value of the dollar

              finster, one of the things i track with my own investments is the total value in oz of gold, and the total value times the dollar index, a rough measure of the global purchasing power of my assets. my hope is that over time i get a return that exceeds the decline of the dollar index.

              if your fdi is a measure of the value of a dollar, then the product of the s&p and the fdi would tell you the global purchasing power of the equity index, and make obvious the degree to which the equity index is inflating instead of gaining value as it rises.

              Comment


              • #52
                Re: issue of inflation as depicted by Finster's USD chart.

                Originally posted by bart
                I hope this doesn't come across as pandering but that chart isn't even something I'd attempt. Excel is quite poor at log charts - a double doff of the chapeau to you for pulling it off.

                One of these days I'll install Excel 2007 beta in a separate virtual machine and see if it improves on the log chart capability.
                Well at least I don't feel quite so bad about my less-than-elegant results ... big dittos on the limited native log charting in Excel. If only it had more control over the axis scaling and labelling. Please let me know if you find something better!
                Finster
                ...

                Comment


                • #53
                  Re: the s&p and the value of the dollar

                  Originally posted by jk
                  if your fdi is a measure of the value of a dollar, then the product of the s&p and the fdi would tell you the global purchasing power of the equity index, and make obvious the degree to which the equity index is inflating instead of gaining value as it rises.
                  Exactly.

                  And when we do this, we find that the broad equity indexes have gone almost nowhere since the first rebound out of the March 2003 trough. The below is the product of the S&P and FDI converted to log for charting purposes.

                  The line "REAL" is the FDI-adjusted S&P 500, and the "NOM" the current-dollar reported value.

                  Last edited by Finster; August 19, 2006, 09:31 AM.
                  Finster
                  ...

                  Comment


                  • #54
                    Re: the s&p and the value of the dollar

                    Originally posted by jk
                    finster, one of the things i track with my own investments is the total value in oz of gold, and the total value times the dollar index, a rough measure of the global purchasing power of my assets. my hope is that over time i get a return that exceeds the decline of the dollar index.
                    Funny you should mention that, because one of the prime motivations in creating the FDI was to track real portfolio value. I use it to convert current dollar values to constant Y2KD before I even calculate my returns. It comes in especially handy in that it allows me to set a fixed overall portfolio size target that I don’t then have to separately make allowance for inflation for.

                    Actually the conventional USDX and the FDI are similar in concept. The main difference is that the USDX pits the USD against other currencies which themselves have a tendency to lose value over time, so will fail to account for global inflation. FDI is kind of like having a USDX except each of the other currencies in the basket is itself adjusted for inflation, and the inflation-adjusted USD itself is included.
                    Finster
                    ...

                    Comment


                    • #55
                      Re: What's with Bernanke jawboning the stock market upwards?

                      Originally posted by jk
                      the economist magazine has been posting a big mac index for years. it's a standardized item that allows direct comparison of purchasing power. it's actually not a bad index.
                      Agreed, and its quite clever too.

                      I do track it on a non public chart, and would post it but its copyrighted.
                      http://www.NowAndTheFuture.com

                      Comment


                      • #56
                        Re: issue of inflation as depicted by Finster's USD chart.

                        Originally posted by Finster
                        Well at least I don't feel quite so bad about my less-than-elegant results ... big dittos on the limited native log charting in Excel. If only it had more control over the axis scaling and labelling. Please let me know if you find something better!
                        Wilco on letting you know.

                        I've fiddled with a few freeware and shareware apps over the last year with little luck. Here's hoping on Excel 2007, whenever the round tuits are available and its a little further into the beta.
                        http://www.NowAndTheFuture.com

                        Comment


                        • #57
                          Re: issue of inflation as depicted by Finster's USD chart.

                          Originally posted by Jim Nickerson
                          Now, I believe, someway if EJ could agree that what appears great to me is in fact great, then possibly he could incorporate your FDI (blue line) and the SPX into his Ka-Poom chart. I do not have an idea as to what he might do with projections from present forward with regard to FDI and SPX, as he has projected inflation on his last update in the Ka-Poom chart. It would be appropriate to me if he just would leave the FDI and SPX to where they are now. His Ka-Poom chart only has two data charted, both in percent. To utilize the FDI, someway it would have to be converted to percent--I presume that could be done. For my liking EJ's Ka-Poom chart would be more meaningful if it as least had an equity index on its right scale to now. Just one man's ideas.
                          EJ's Ka-Poom chart and the FDI actually jibe pretty well. The CPI is not very good for indentifying periods of deflation such as those identified on the Ka-Poom chart because deflation has to been fairly prolonged and/or deep to register there, and even when it does, it's well after the fact. More likely, the CPI will, as suggested on the chart, merely indicate disinflation. The "Ka" period, as desrcibed below (http://www.itulip.com/forums/showthread.php?t=336) is likely to register as deflation on the FDI, as well as be registered sooner than in the CPI.

                          Originally posted by Fred
                          But before the "Poom" comes the "Ka," a period of deflation. Evidence abounds that the beginning of the beginning of the Ka process has begun. There will later be an end of the beginning, when the Fed begins its experiments with non-traditional means of deflation fighting, and beginning of the end when these begin to work too well. But for now, home prices are falling, oil demand and prices are falling, auto sales are off, the DOW transports are off, numismatic coins are, like over-priced homes, sitting unsold at inflated prices. Only the highest of the high end of these are doing well, purchased with Gatsby hedge fund wealth.
                          Finster
                          ...

                          Comment


                          • #58
                            Inflation prediction

                            Originally posted by Finster
                            EJ's Ka-Poom chart and the FDI actually jibe pretty well. The CPI is not very good for indentifying periods of deflation such as those identified on the Ka-Poom chart because deflation has to been fairly prolonged and/or deep to register there, and even when it does, it's well after the fact. More likely, the CPI will, as suggested on the chart, merely indicate disinflation. The "Ka" period, as desrcibed below (http://www.itulip.com/forums/showthread.php?t=336) is likely to register as deflation on the FDI, as well as be registered sooner than in the CPI.

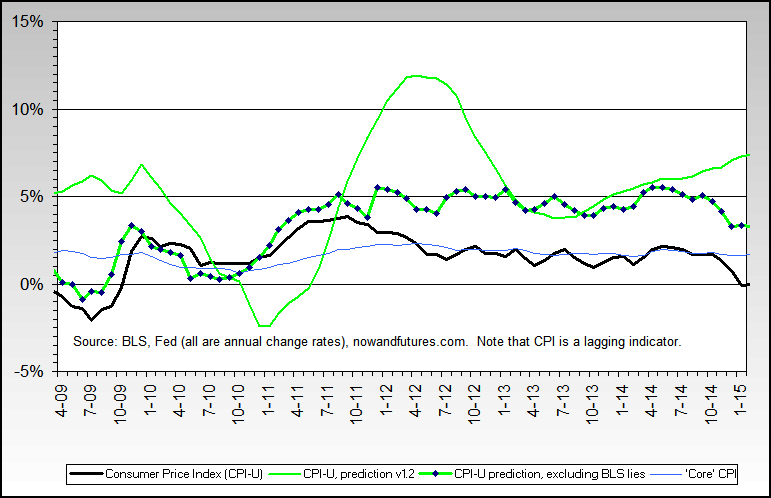
                            This seems like as good a place as any to jump in with a chart that attempts to predict both the CPI and real inflation.

                            The two green lines are one predictive approach and they're based on the lagged nature of monetary policy and a weighted combination of things like bank credit, M1 and repos. The dotted green line just has John Williams public adjustments added to the solid green line.

                            The second approach is the annual rate of change of M3 minus M2, with an added lag plus a John Williams based adjustment. Its primarily in there as both a timing aid and a sanity check on the other formula.


                            http://www.NowAndTheFuture.com

                            Comment


                            • #59
                              Re: What's with Bernanke jawboning the stock market upwards?

                              Originally posted by bart
                              Pardon me for jumping in, and I'll let Finster explain his creation, but I just had to agree on you regretting the question... ;-)
                              Well, Bart, it turns out that I do not regret asking the question because it seems to me that it turned out to be a good question and has evoked a lot of further explanation by Finster which has added to my perspective of the relativity of things.

                              I will be glad when Finster updates his website with the new charts and especially the current FDI data in Excel format.
                              Jim 69 y/o

                              "...Texans...the lowest form of white man there is." Robert Duvall, as Al Sieber, in "Geronimo." (see "Location" for examples.)

                              Dedicated to the idea that all people deserve a chance for a healthy productive life. B&M Gates Fdn.

                              Good judgement comes from experience; experience comes from bad judgement. Unknown.

                              Comment


                              • #60
                                Re: What's with Bernanke jawboning the stock market upwards?

                                Originally posted by Jim Nickerson
                                Well, Bart, it turns out that I do not regret asking the question because it seems to me that it turned out to be a good question and has evoked a lot of further explanation by Finster which has added to my perspective of the relativity of things.

                                I will be glad when Finster updates his website with the new charts and especially the current FDI data in Excel format.
                                I couldn't agree more. The FDI and his approach certainly isn't exactly inside the "normal" box - and its a (usually pleasant) stretch for most to understand what he's doing. My comment on regret was very much intended as a tongue in cheek comment too, as I think you know.

                                A number of my non public charts do use the FDI, both as sidechecks to my own work and also because there's nothing else like it for leveling the field on a world wide basis. In other words, me too on his site update.
                                http://www.NowAndTheFuture.com

                                Comment

                                Working...
                                X