I started writing this a week ago and hesitated because I don't really feel qualified to comment. I keep hoping that EJ will write a sweeping review where he puts everything into perspective. I understand that virZOOM is making a historic move and that he is very busy. I don't want to wait any longer so I am hoping that this will prompt some clarifying discussion.
I thought I would write something about what is going on right now. I'm trying to follow the zigs and zags of the macro-economic picture every day but I feel like a dog trying understand human language. I understand fetch, roll over, play dead and so forth but I'm mostly puzzled by what I see happening in markets. I recall that during the last financial crisis professional economists for the most part failed to understand what was happening at the moment, let alone grasping why it was happening. With that in mind let me try to describe what I see happening, then I will try to fit it into a framework that will be understandable by itulip people.
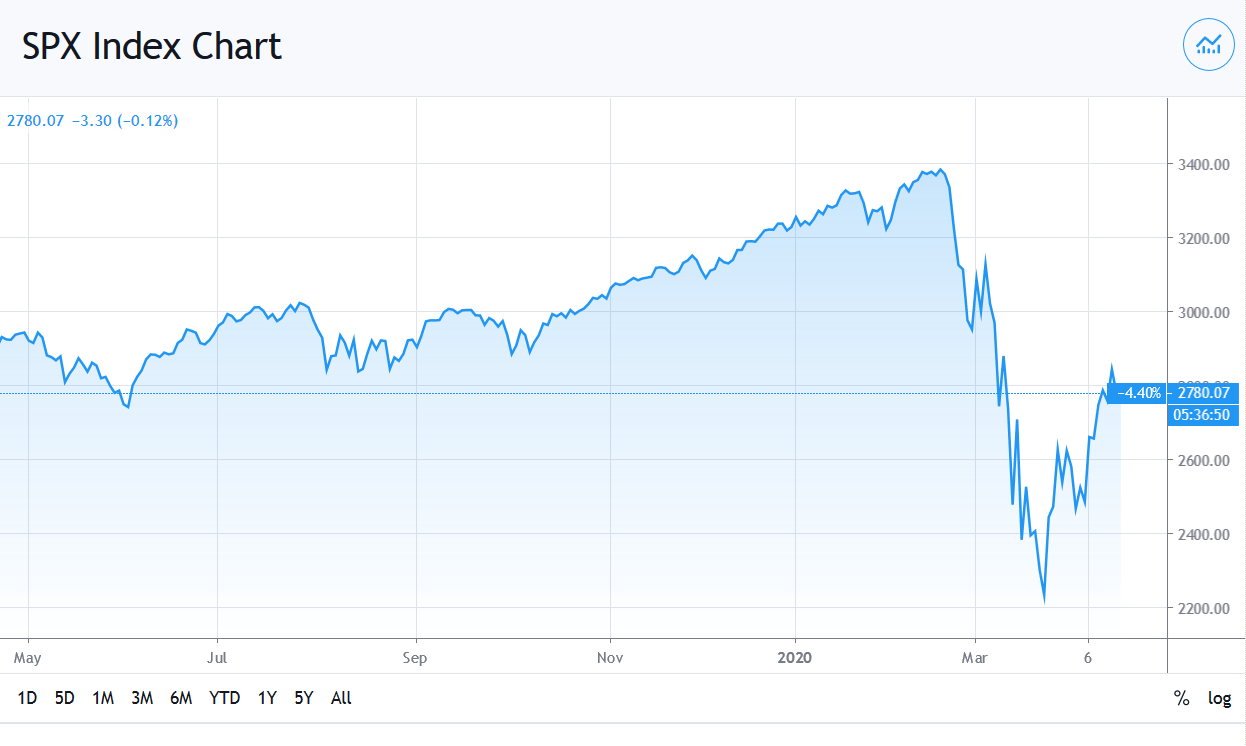
Let's start small. I see that the stock market has dropped and retraced about 50%:
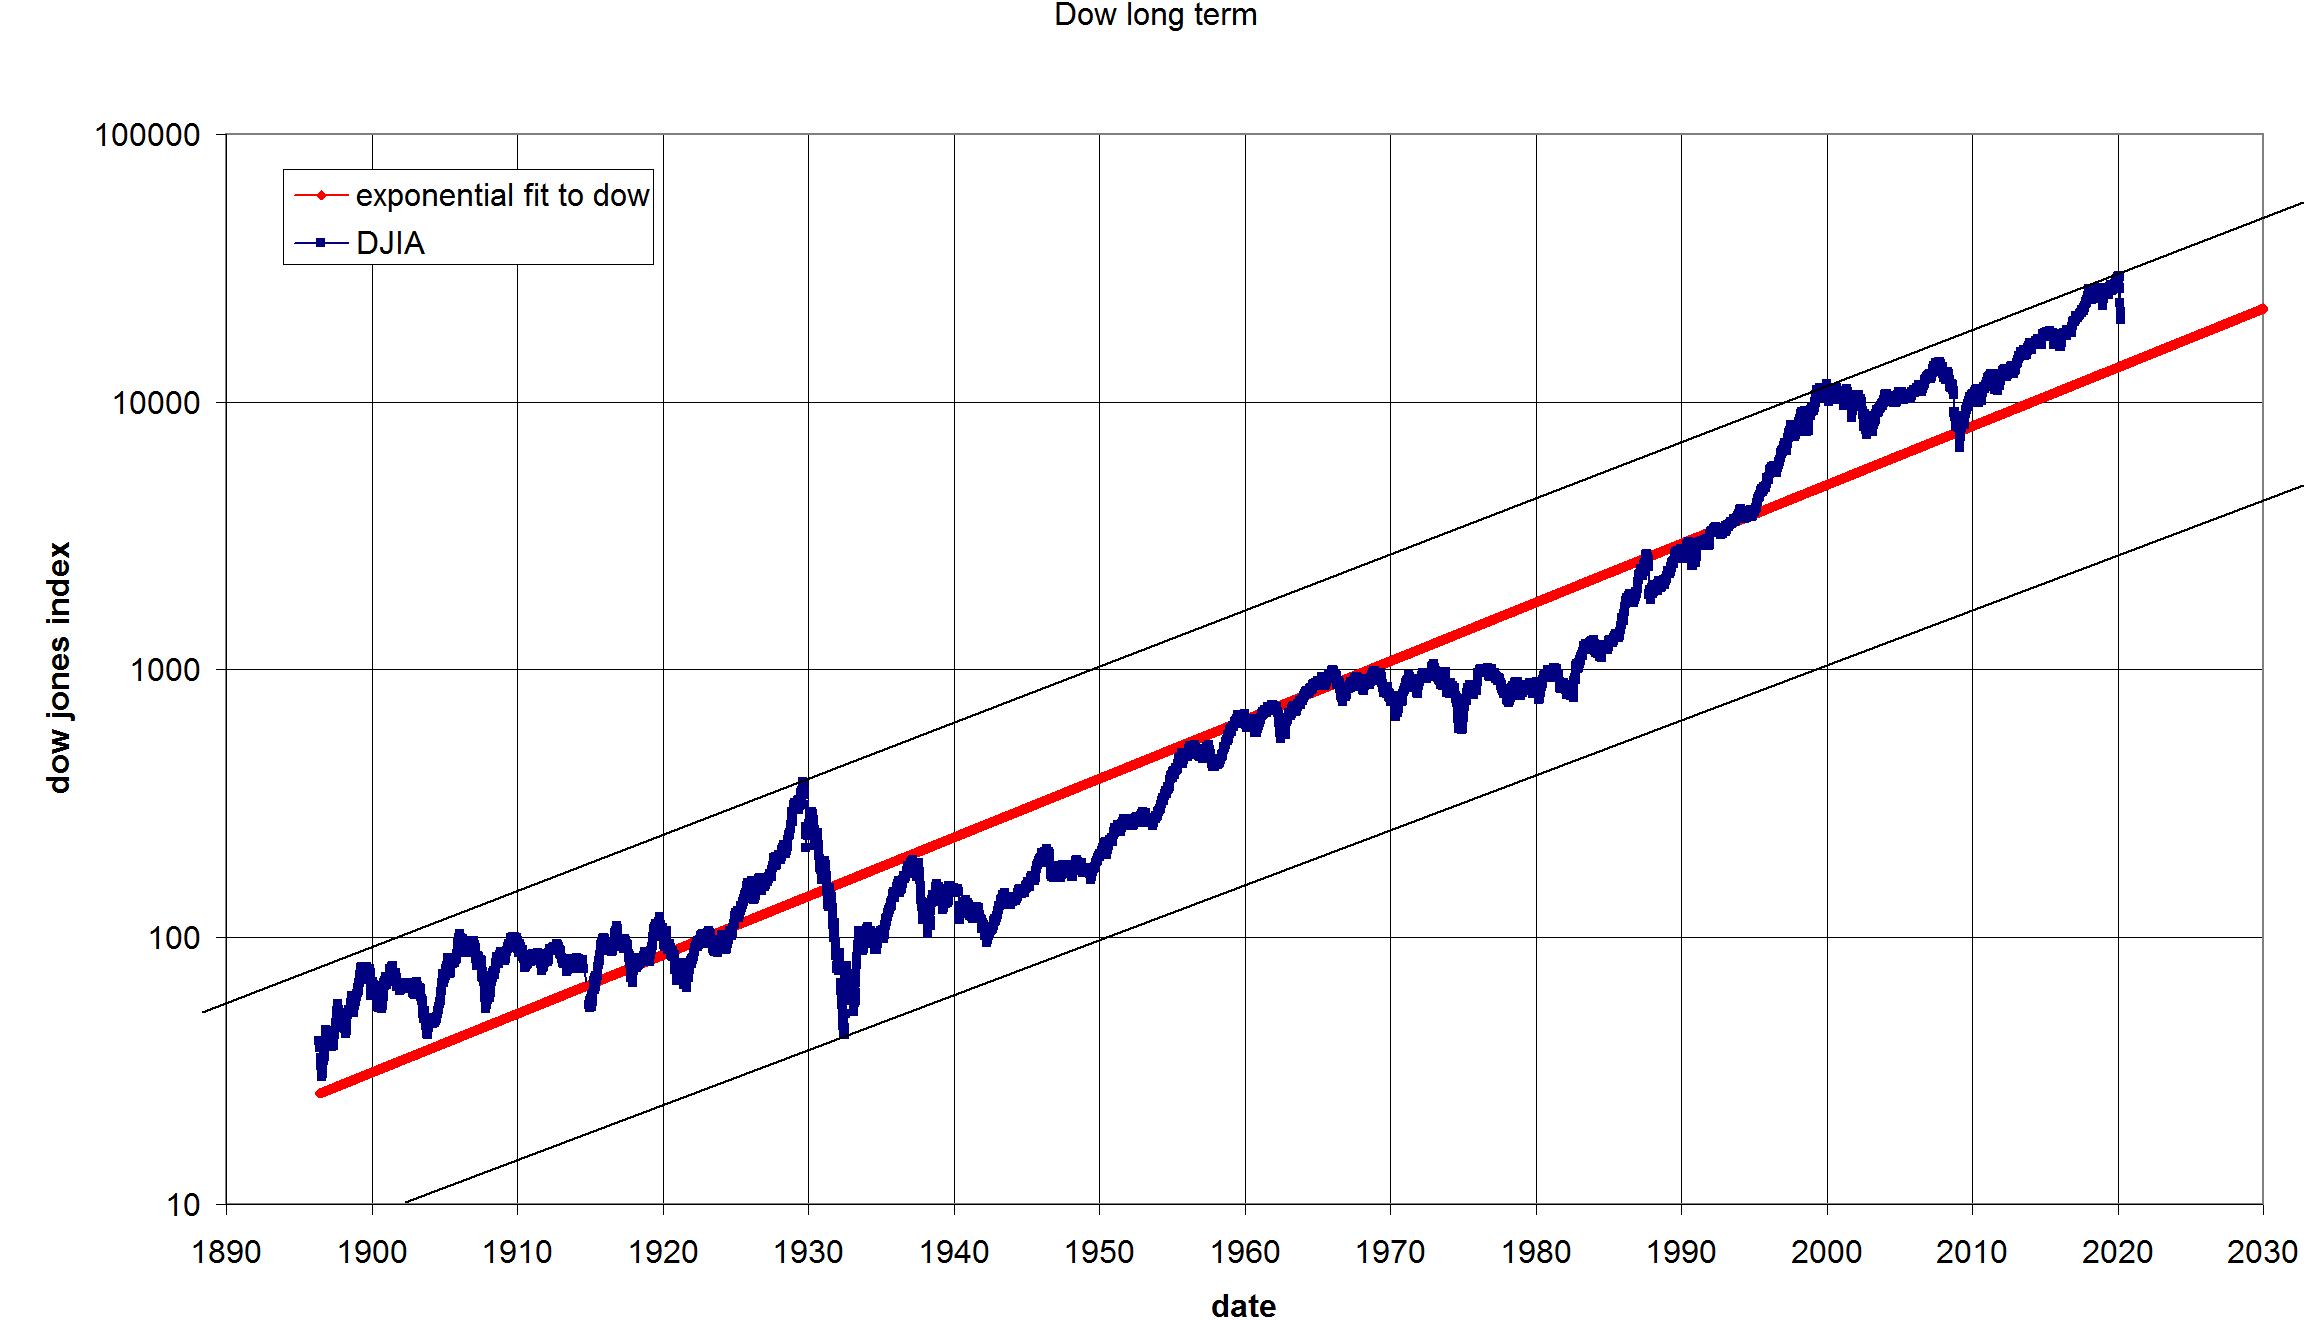
Longer term it looks like nothing special happened:
Oil dropped below $20 and the Gold Oil ratio took it's marbles and went home:

Gold itself has been moving higher but I wouldn't describe it as explosive:
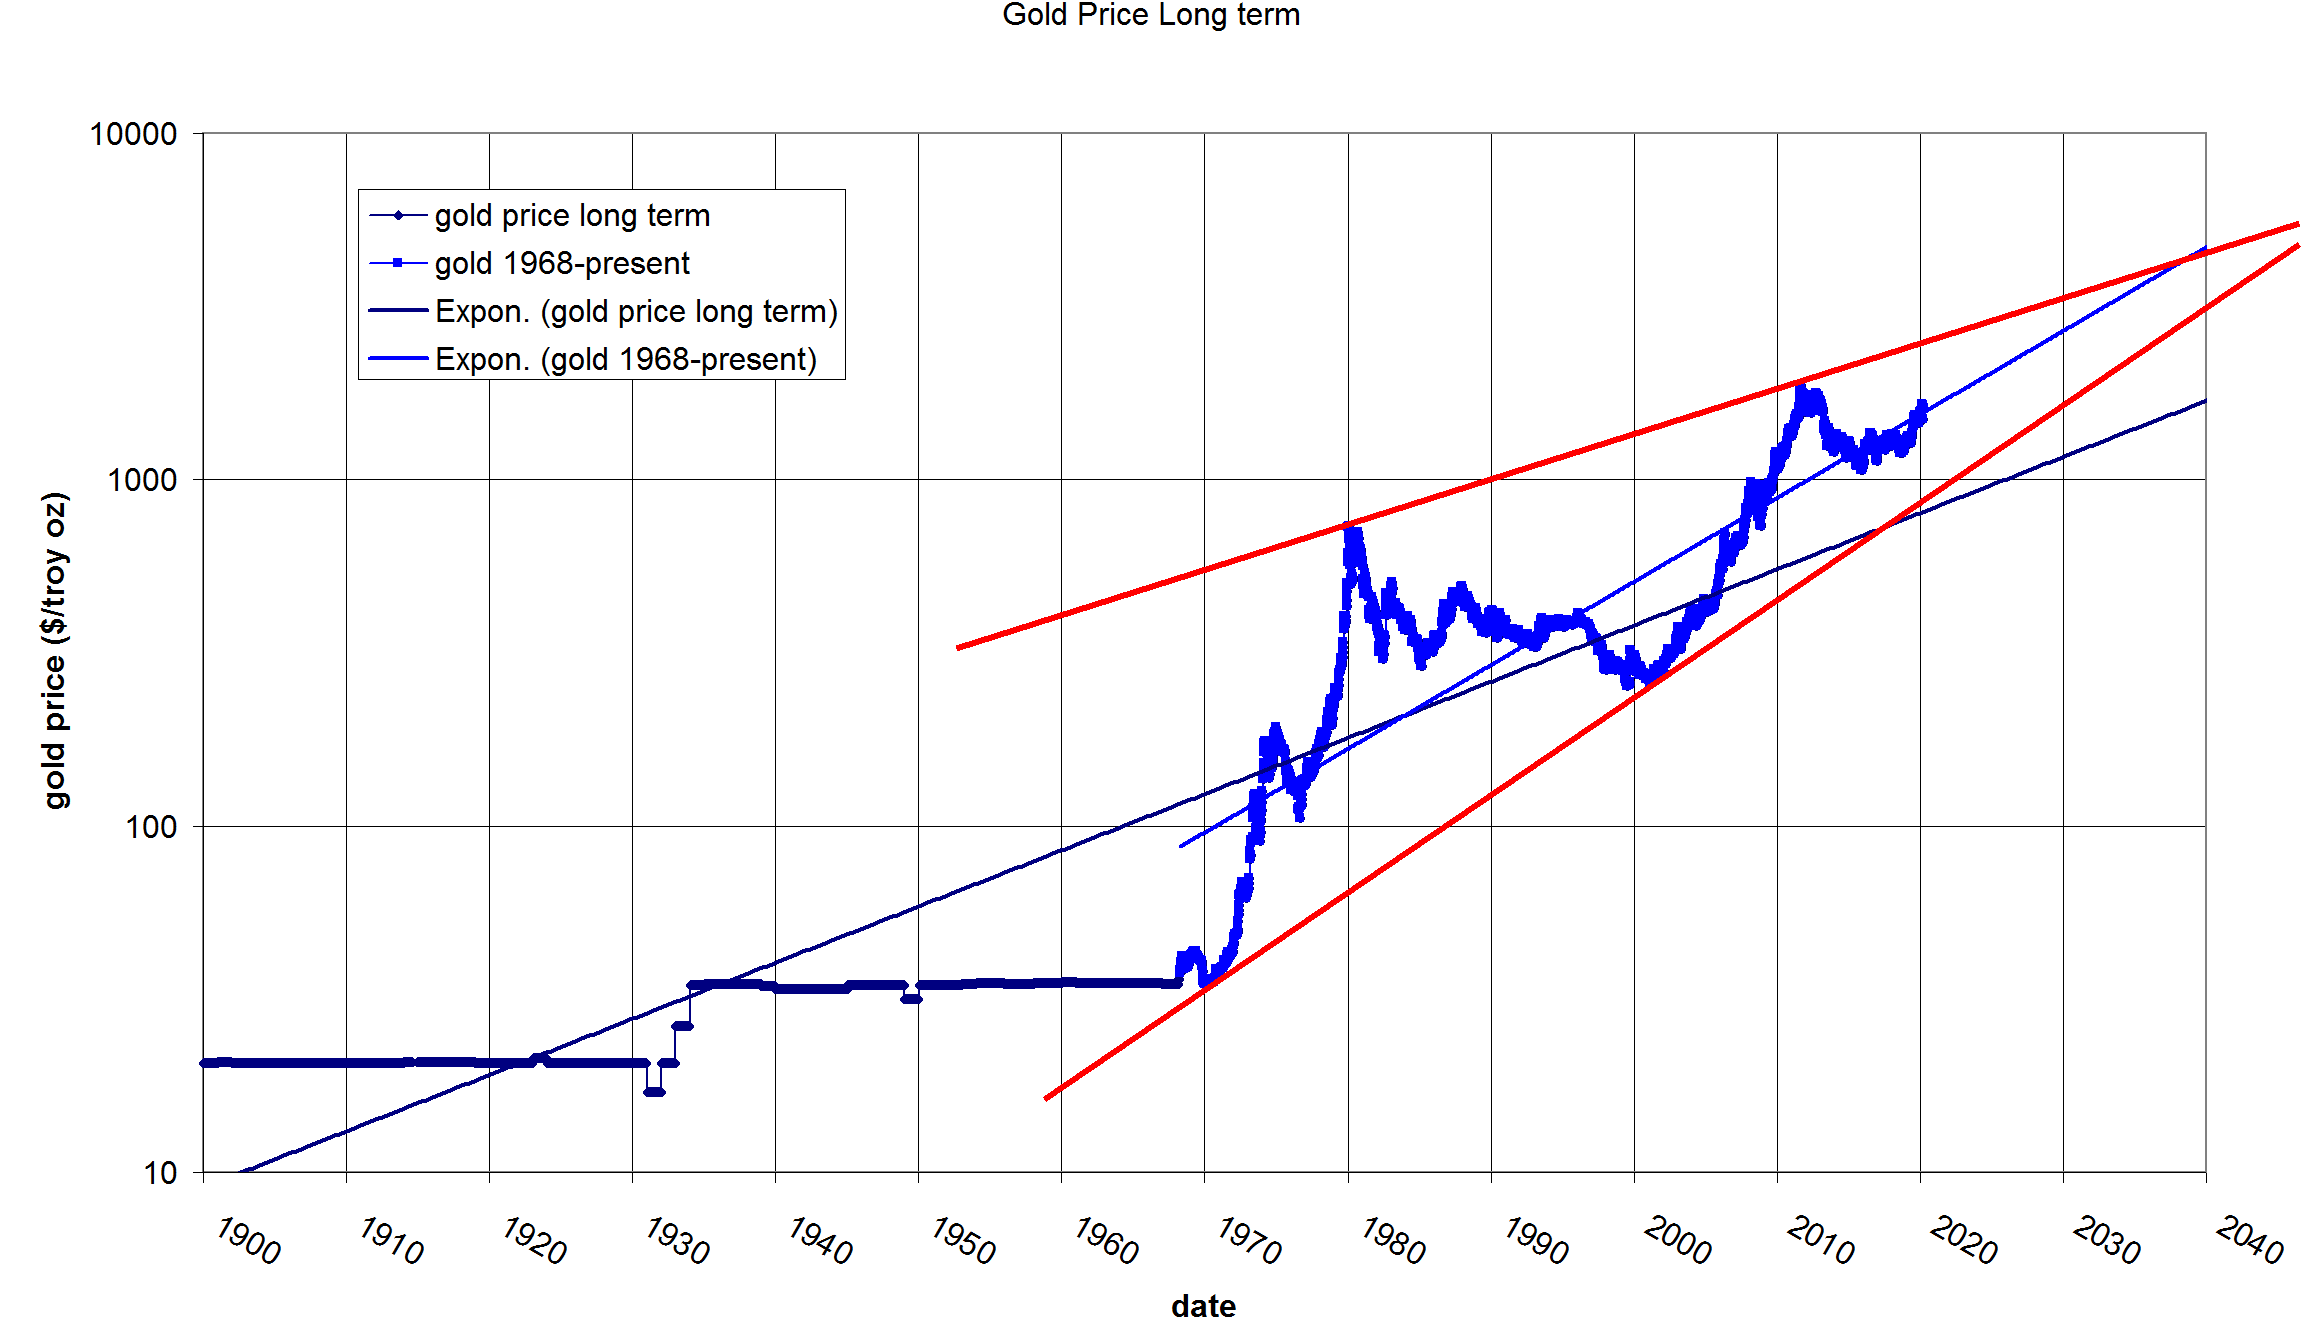
Despite a spirited move up, gold has yet to reach new highs.
Gold vs. stocks is also looking like it might take a while to find a new level:
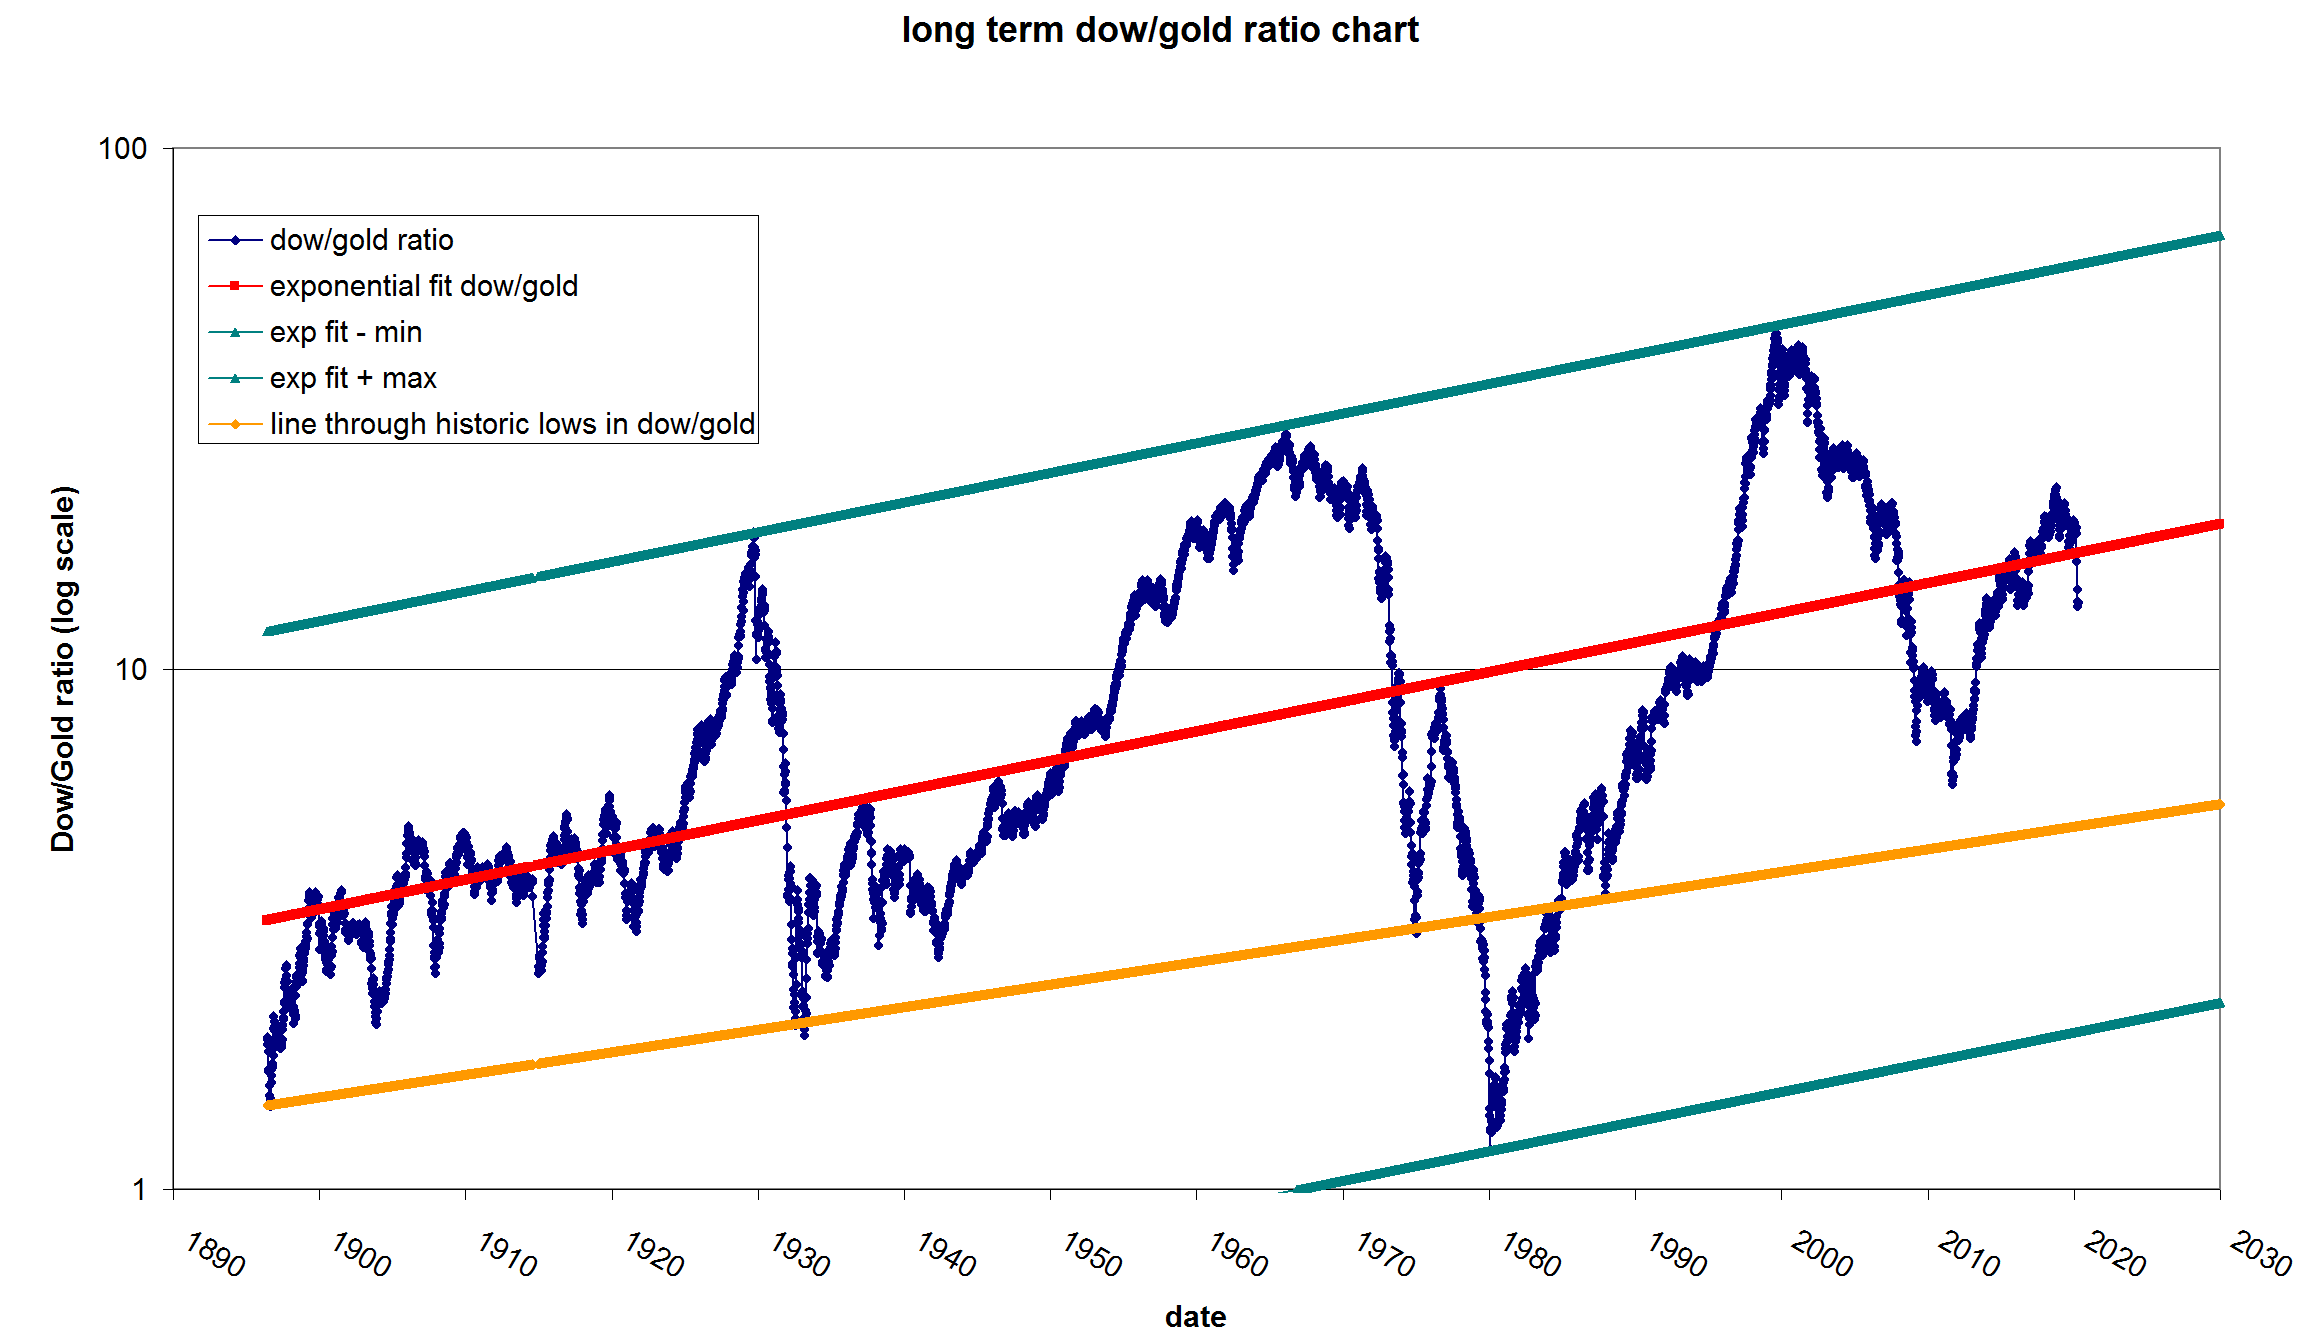
Still hovering near the red line after three months of hell.
What is the dollar doing? So far it is hard to pick a winner in this. I understand Austria is ending confinement and, just judging by the charts , Australia and NZ are getting this epidemic under control.
I look at the Euro:
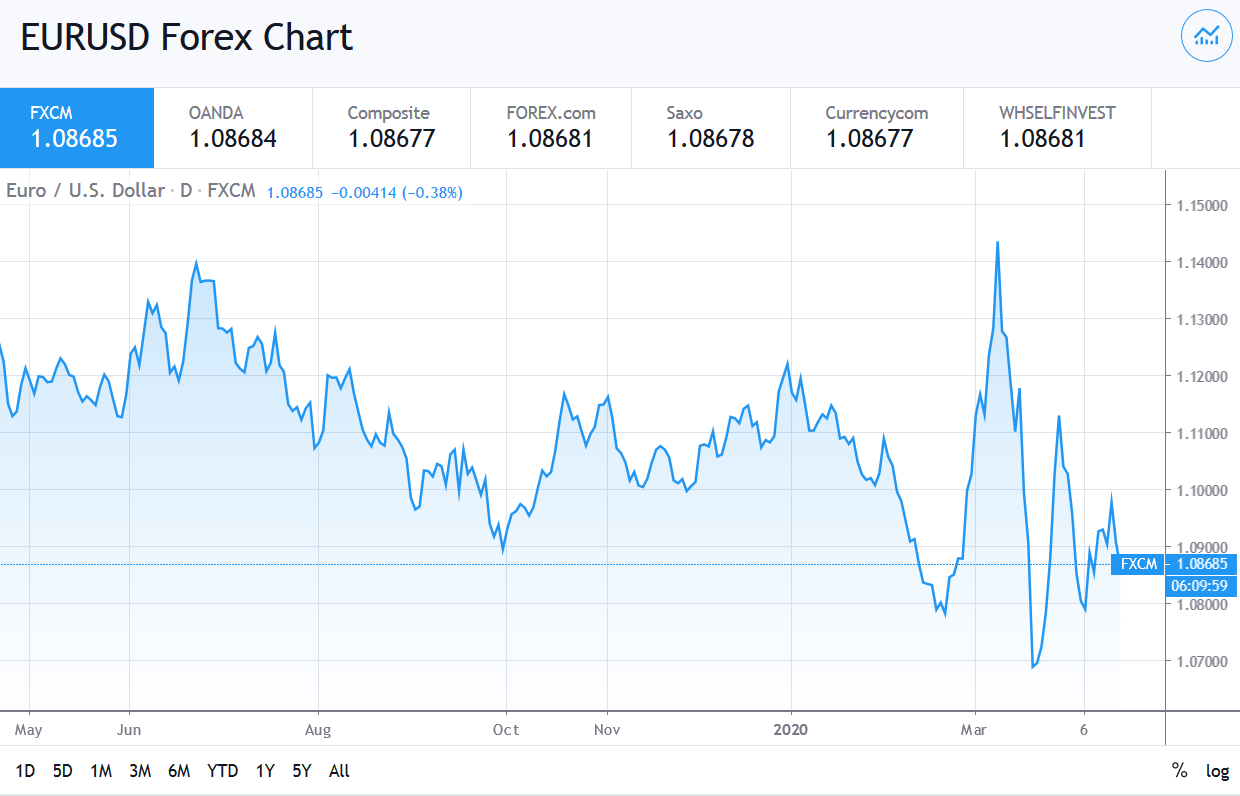
The Euro is doing the Funky Chicken.
What about the Dollar? I have always had a problem with measuring the dollar. It seems like it ought to be easy to measure the dollar. You take the exchange rate of the US with other countries and multiply by a fudge factor relating to the amount of trade. Simple right? Weeellll it seems we have a little problem. It looks like the Federal reserve stopped published the dollar index about the first of the year. They now publish a new index that is weighted by both trade in goods AND services. The problems I have with this are (a) services are not measurable and (b) you can't compare the new and old indexes:

I tried to make a new index by squashing the two together:
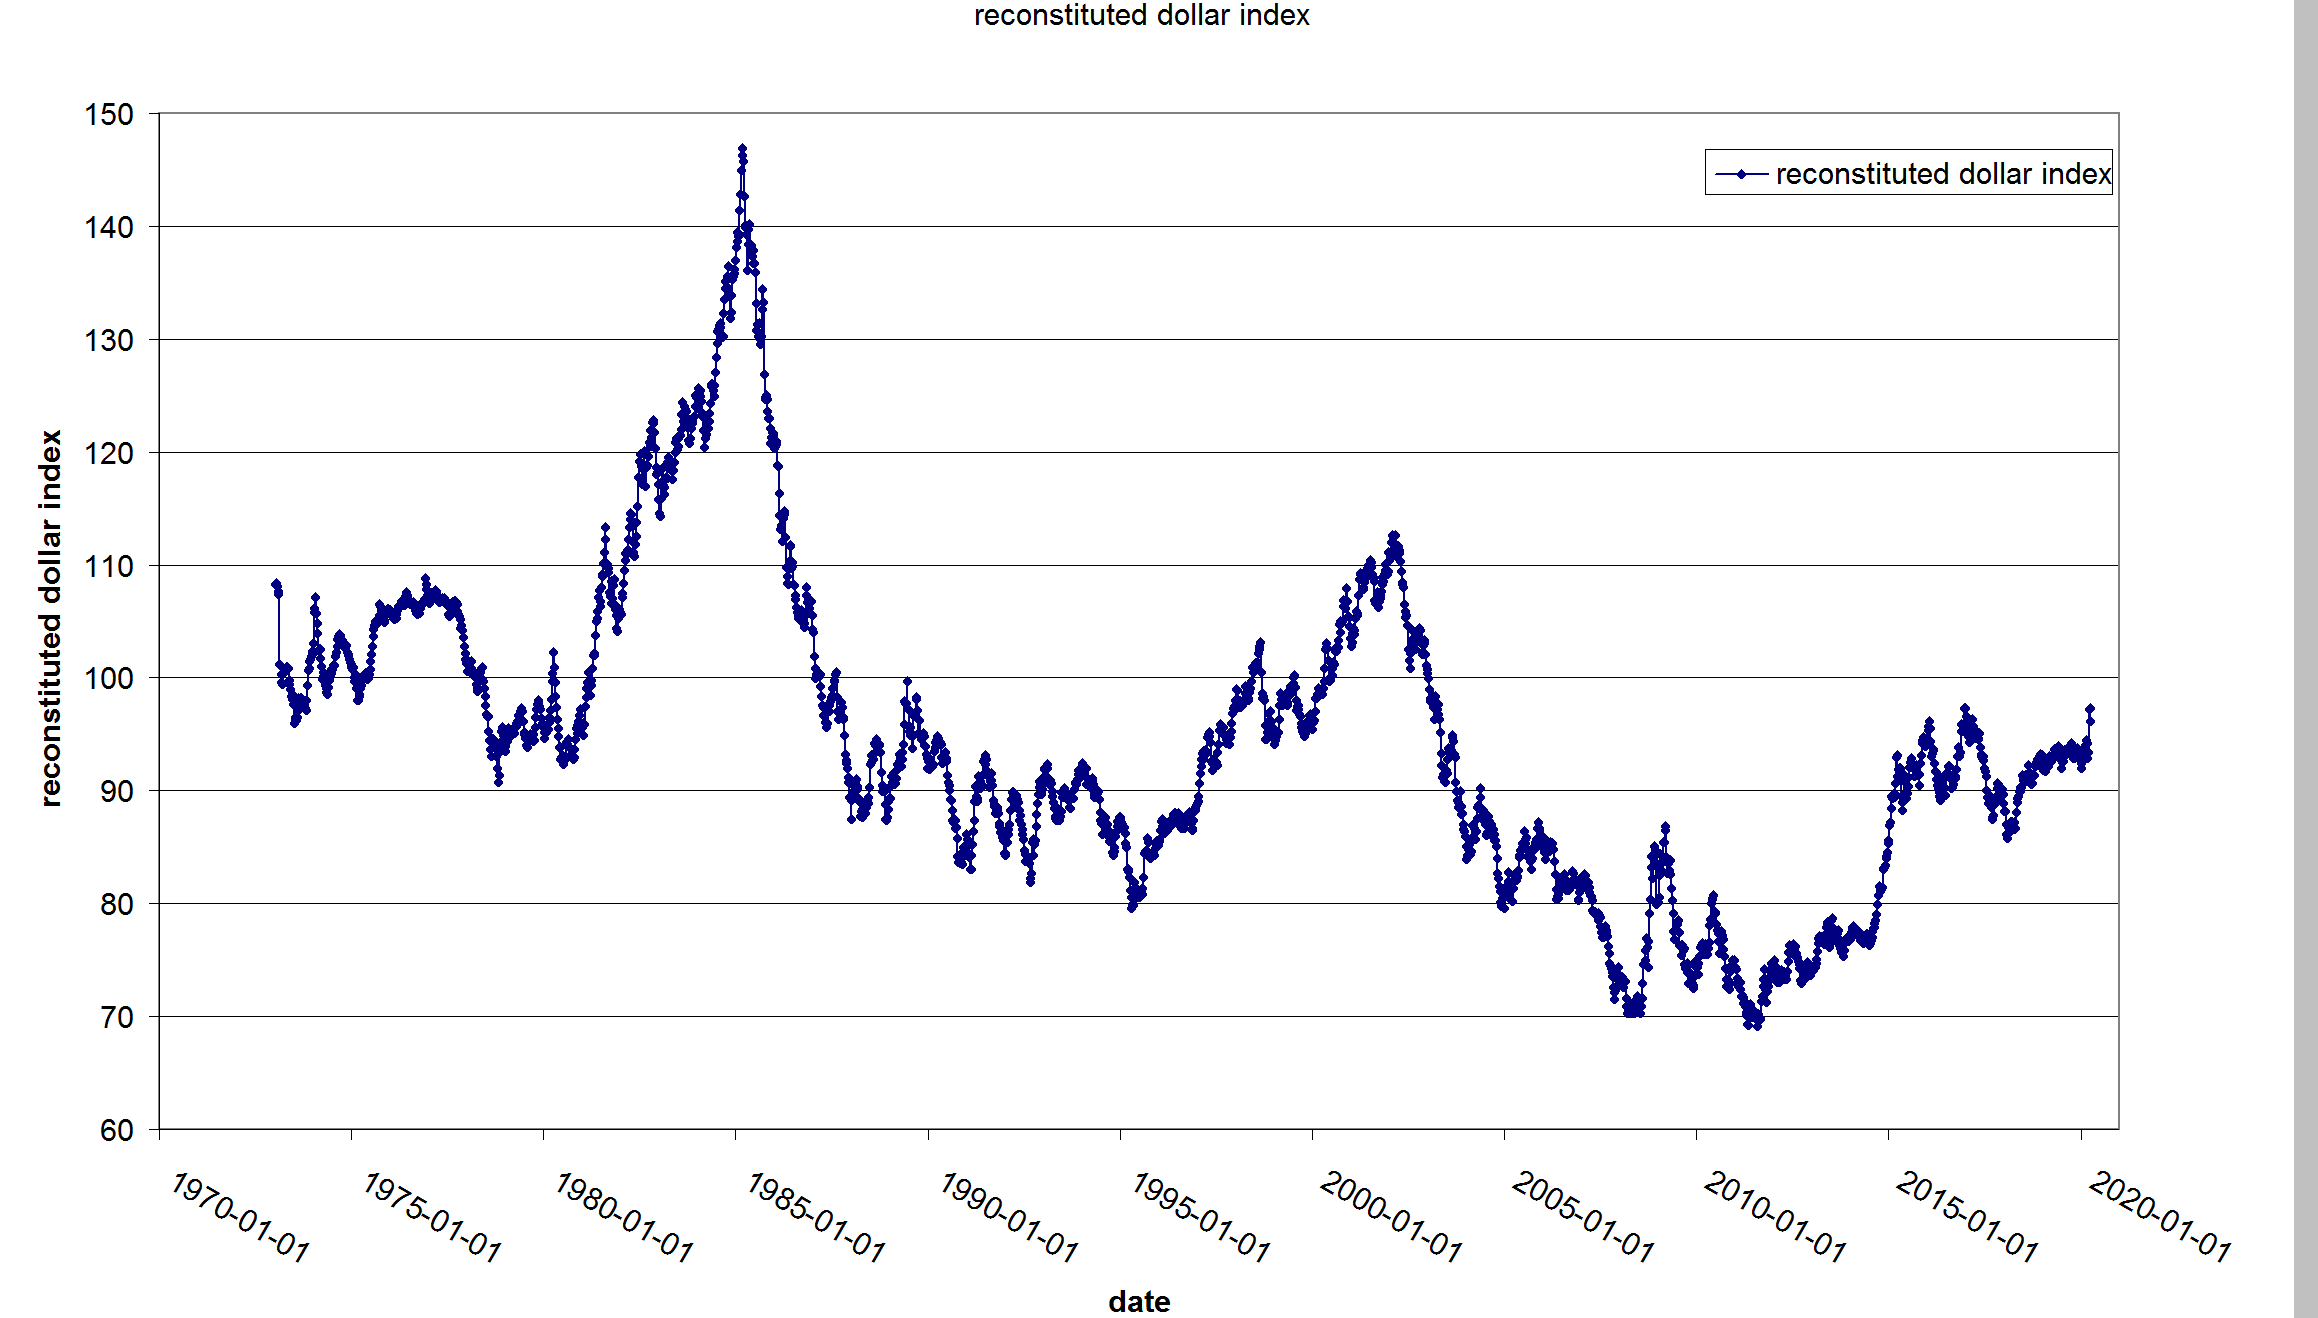
I don't think it is worth much.
The other issue I have with this is that world trade has collapsed. It seems like the before and after picture is like comparing apples and oranges. This is China:
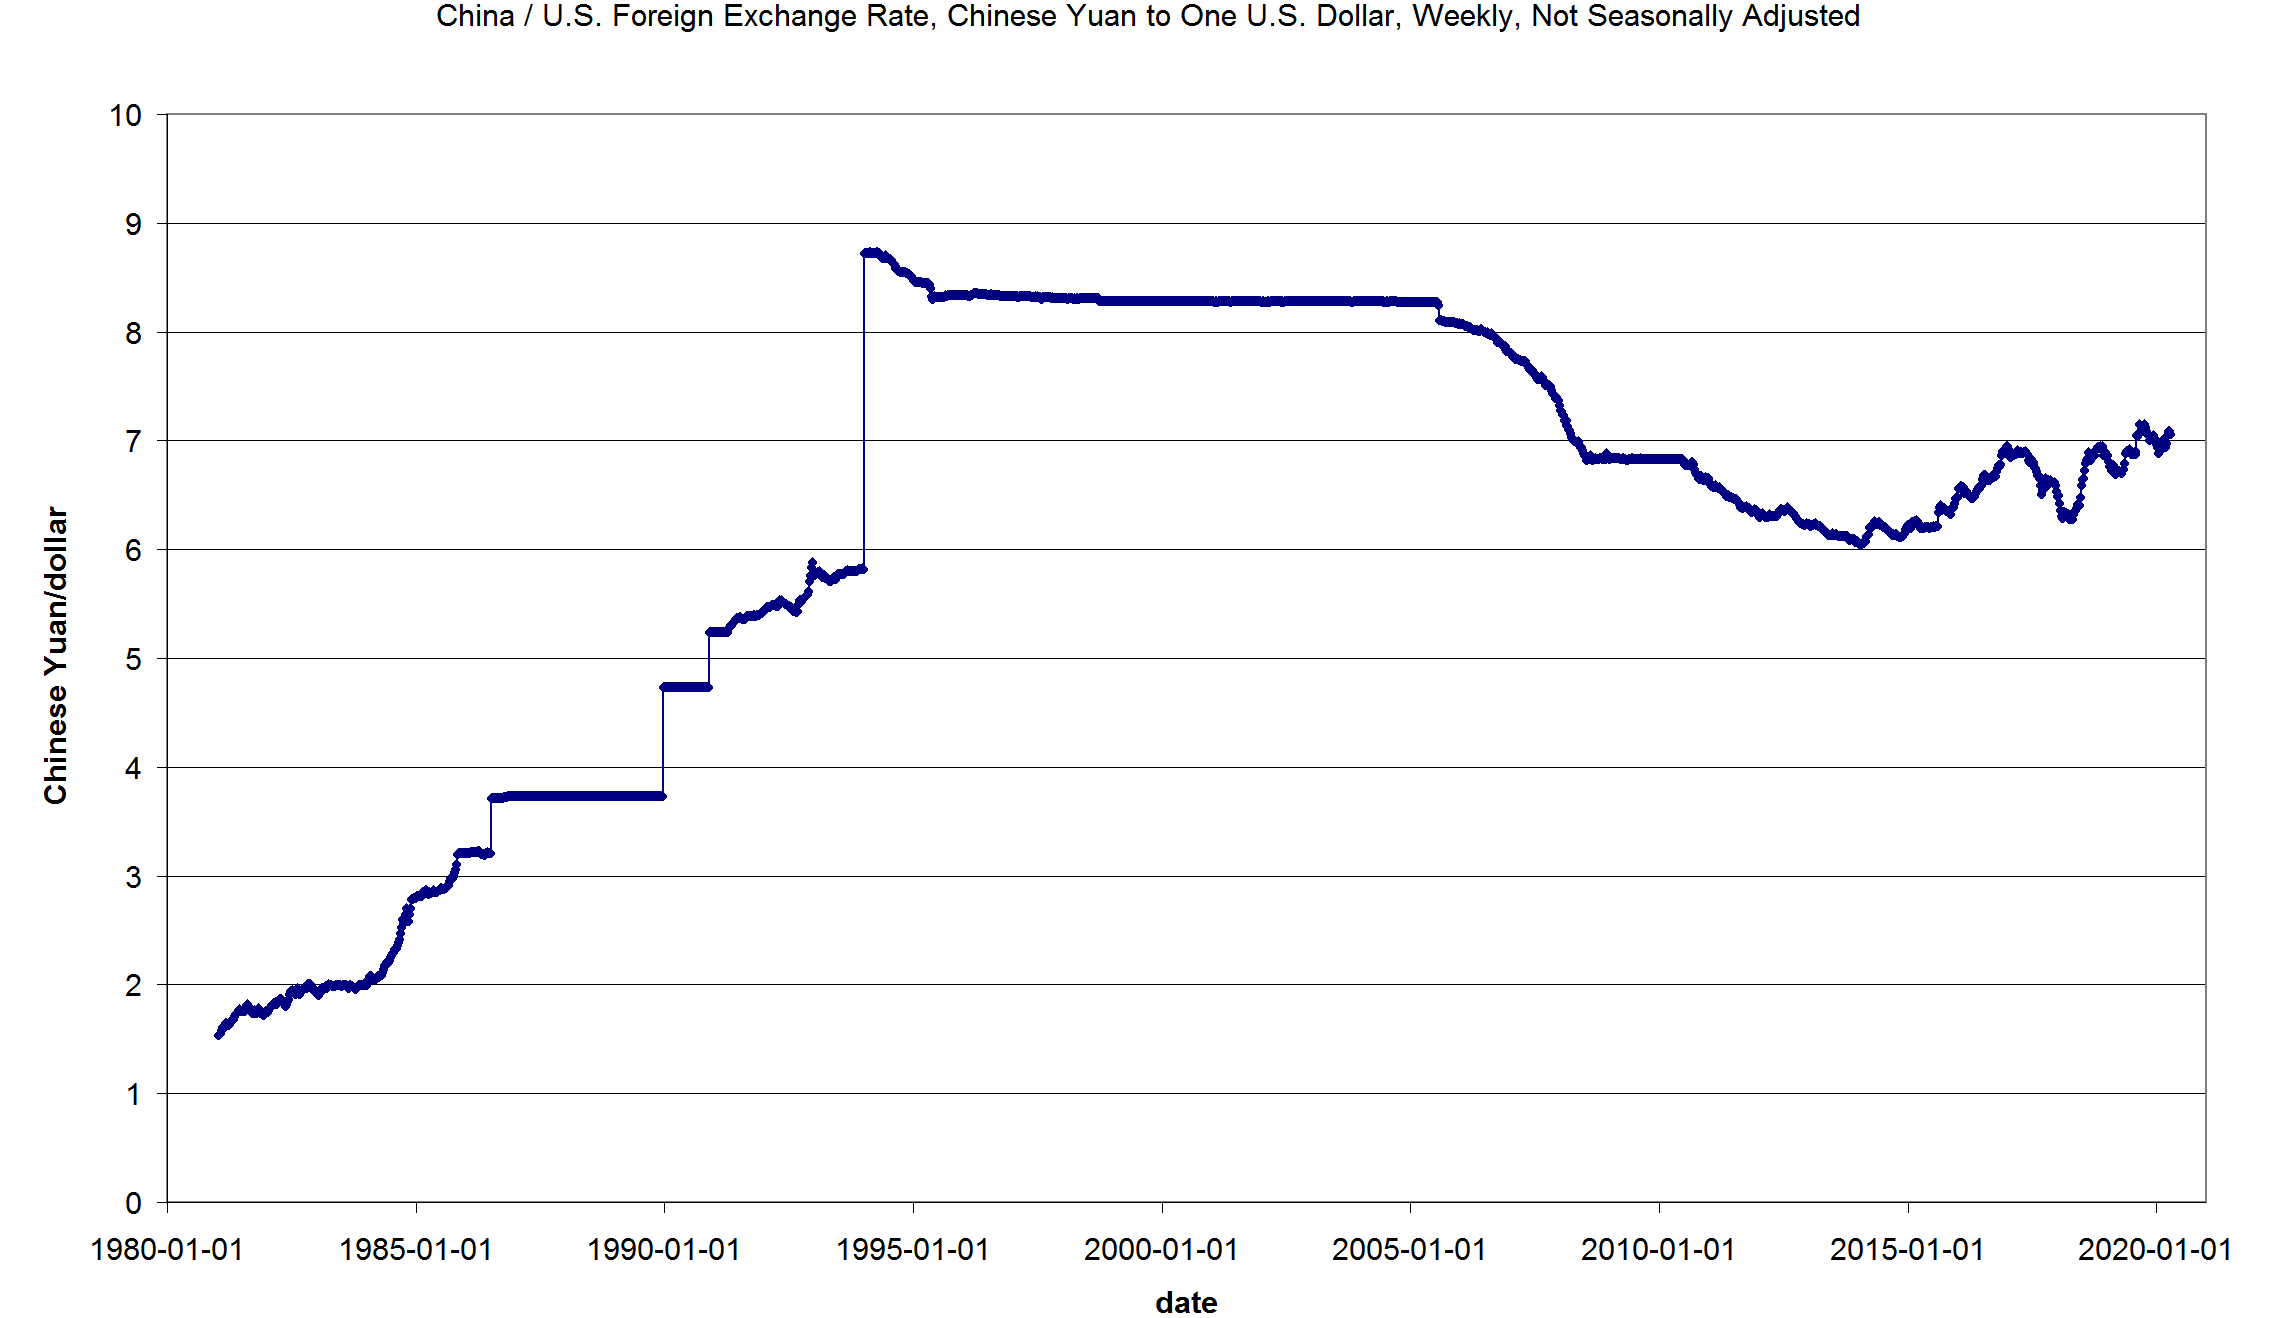
It looks like there was never any crisis, or maybe China has pegged it's currency to the dollar.
I expected the Pound to collapse but it is holding at the same levels it held for years.
Let's cut to the chase. I follow Brent Johnson who has been promoting his dollar short squeeze theory. If you follow Jeff Snider he also is a fan of this Triffin's Dilemma kind of thinking. On the other hand this is Josh Crumb on MacroVoices the other day:
So my question to you is: What is going on?
I thought I would write something about what is going on right now. I'm trying to follow the zigs and zags of the macro-economic picture every day but I feel like a dog trying understand human language. I understand fetch, roll over, play dead and so forth but I'm mostly puzzled by what I see happening in markets. I recall that during the last financial crisis professional economists for the most part failed to understand what was happening at the moment, let alone grasping why it was happening. With that in mind let me try to describe what I see happening, then I will try to fit it into a framework that will be understandable by itulip people.
Let's start small. I see that the stock market has dropped and retraced about 50%:

Longer term it looks like nothing special happened:

Oil dropped below $20 and the Gold Oil ratio took it's marbles and went home:

Gold itself has been moving higher but I wouldn't describe it as explosive:

Despite a spirited move up, gold has yet to reach new highs.
Gold vs. stocks is also looking like it might take a while to find a new level:

Still hovering near the red line after three months of hell.
What is the dollar doing? So far it is hard to pick a winner in this. I understand Austria is ending confinement and, just judging by the charts , Australia and NZ are getting this epidemic under control.
I look at the Euro:

The Euro is doing the Funky Chicken.
What about the Dollar? I have always had a problem with measuring the dollar. It seems like it ought to be easy to measure the dollar. You take the exchange rate of the US with other countries and multiply by a fudge factor relating to the amount of trade. Simple right? Weeellll it seems we have a little problem. It looks like the Federal reserve stopped published the dollar index about the first of the year. They now publish a new index that is weighted by both trade in goods AND services. The problems I have with this are (a) services are not measurable and (b) you can't compare the new and old indexes:

I tried to make a new index by squashing the two together:

I don't think it is worth much.
The other issue I have with this is that world trade has collapsed. It seems like the before and after picture is like comparing apples and oranges. This is China:

It looks like there was never any crisis, or maybe China has pegged it's currency to the dollar.
I expected the Pound to collapse but it is holding at the same levels it held for years.
Let's cut to the chase. I follow Brent Johnson who has been promoting his dollar short squeeze theory. If you follow Jeff Snider he also is a fan of this Triffin's Dilemma kind of thinking. On the other hand this is Josh Crumb on MacroVoices the other day:
Josh: Hi, Erik. Thanks, itís good to be back.
One thing that I would say right up front is I actually donít believe so strongly in this narrative of sell everything, dollar short squeeze, and this sort of view.
And Iíll explain how I look at it, which ultimately comes out to be something similar, I would say. But there is a fundamental behind it.
So when I look at gold-trading markets, gold-price markets, thereís a couple of things that are important to look at.
Whatís the actual physical flow for gold and the gold demand? Call it on Main Street or the real economy.
And then, whatís the demand for futures and just gold exposure on Wall Street?
If you look at what the demand for gold exposure is, itís actually still extremely well correlated with real interest rate expectations. Even when we saw that spike up to $1,700 in early March, that subsequently collapsed very quickly to (I think it was) $1,550 or $1,525. It was a pretty dramatic swing in the gold price.
It actually still matched up extremely well with the pricing of real interest rates as seen in, say, the 10-year TIPS market.
So what was happening is the dollar short squeeze wasnít just the physical commodity short squeeze, where youíre selling everything, but also the models and people that trade the gold price futures based on metrics like real interest rate expectations and TIPS correlations. So that also happened.
Thatís sort of whatís happening in (call it) the paper gold market, the machines, the algorithms.
When we saw that happen, we actually very quickly saw Ė real interest rates actually went up because, essentially, the market was pricing deflation very, very quickly because of the zero lower-bound.
If you price that the world is going into a deflationary, say, negative 2% inflation, negative 1% inflation, but youíre trapped at that zero-bound, it actually means that you have positive real interest rates, even though growth may be negative.
This is one of the hardest concepts for people to think about, particularly when theyíre thinking about gold. And so we actually saw a very fundamental selloff on that real interest-rate spike.
However, that got unwound very quickly. Not just with Fed actions but, in general, you saw it across many assets.
So gold rebounded very quickly back into the $1,650 type of range, which is actually very well predicted by the model that I actually helped develop. And Goldmoney Research put out an update to that model back in June of last year where basically $1,650 was the target price, back when it was $1,300.
So, despite all the craziness, the model is actually holding up extremely well.
For anyone thatís interested, I do have those models and that research pinned to my Twitter profile right now. I try to keep that information front and center. Because, again, there is a lot of narrative. Thereís a lot of talking about fear and dollar short squeezes and all of these things. But I think itís important to always have it still in a real fundamental model.
And basically whatís happening is this fundamental uncertainty is actually quite significant. We donít know if weíre going to have negative 2% inflation or if weíre going to have plus 2% inflation.
That uncertainty, that window, is actually quite fundamental. And I donít think there is anybody that has a perfect model for where weíre headed.
So, again, that volatility, I think, is fundamentally going to remain for a long time.
But, in my view, in general, I think itís very dangerous to play this game of Iím just going to wait for a dip. Now, if you see a dip, buy it, in my view. Hahaha.
Sorry. In the modelís view, I donít want to make short-term trading recommendations, because thatís never been my framework. But itís really just to help people understand why prices are moving where they are and what that macro framework looks like in the future.
So Iím not making short-term advice. But I do think this dollar short squeeze narrative is overstated, in my view.
So my question to you is: What is going on?


Comment