Announcement

Collapse
No announcement yet.

The Ownership Society

Collapse
X
 
  • Filter
  • Time
  • Show
Clear All
new posts

  • Re: Clinton's Role in Housing

    Originally posted by don View Post
    Clinton - used car salesman makes it (really) big

    George W - idiot son of powerful father

    Obama - 21st century step-and-fetch-it
    I really wanted to disagree with some of this Don but I can't and we're getting Clinton2 or Bush3 next round.

    Comment


    • The Ownership Society

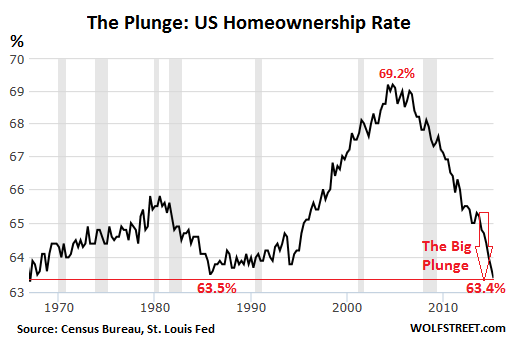
      The rise and fall of the American homeowner: Current homeownership rate is back to where it was 50 years ago.

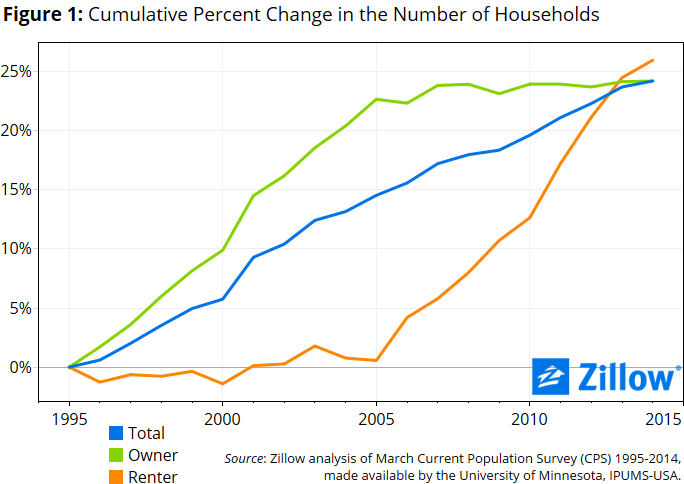
      Historically low interest rates and artificially low inventory has helped to boost home prices but the homeownership rate is in perpetual decline it would seem. There is a tendency to forget that the rise in home values was largely driven by uncharacteristic investor demand for many years. This multi-year buying has resulted in many homes being taken off the market only to be turned into rental units. The numbers are staggering but they are worth repeating: we have added 10 million renter householdsover the last decade while being neutral on actual homeowner households. The math is derived from the grim reality that since the crisis unfolded we have witnessed 7 million Americans undergo the process of foreclosure. This flies in the face of the constant drum beating that somehow buying a house is a sure bet. With most things financial, you have this survivorship bias where those that got smoked out of the market are silent while those that got lucky or timed the market correctly constantly voice their perspective. Yet things are good until they are not.Housing becomes a volatile investment sectorHere is a quote from our banking top chief Ben Bernanke in 2007:

      “At this juncture, however, the impact on the broader economy and financial markets of the problems in the subprime market seems likely to be contained. In particular, mortgages to prime borrowers and fixed-rate mortgages to all classes of borrowers continue to perform well, with low rates of delinquency.”

      Most of the foreclosures that hit the market where in the form of prime mortgages going kaput. Why is the homeownership rate continuing to fall despite record low mortgage rates? The quote from Bernanke simply reflected the popular belief of the overall market. Just a few months ago we had many drinking the perpetually inflated Kool-Aid of the market. Now, volatility is at levels unseen for many years.
      Despite the record rise in the stock market over the last six years, just look at the homeownership rate:


      The current homeownership rate is back to where it was in 1965. We have erased a half-century of gains in this category. The growth in homeownership usually is pushed by young households in family forming ages. But things have changed with Millennials being saddled with massive student loan debtand many earning much less than their parents at similar ages adjusting for inflation. This is why we have many young adults living at home.
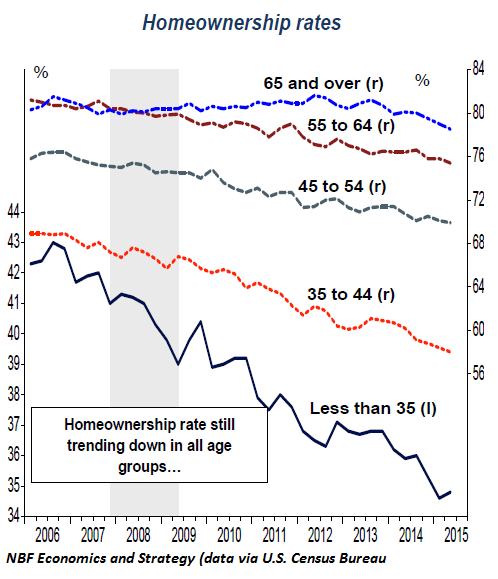
      The trend is consistent for all age groups short of the Taco Tuesday older folks:


      Even in the older age group, the rate has declined. Simply inflating prices for the sake of inflating prices is not good. I know some are laser focused on their crap shack invested hood and somehow feel that massive price mania is justified. But I have to remind many that you don’t get that equity until you sell and these people are house horny and get stuck on a certain zip code. This is how you end up with your 99 Cents Store shoppers in million dollar homes in Pasadena.
      So where do we go from here?Just like in 2007, there has to be a shock to the system. This time, we have plenty of things that can go bananas:

      -China’s massive volatility and slowdown-Europe’s economic mess (i.e., Greece meltdown)-Oil bust (Canada now in recession officially and they have an even bigger housing bubble)-0 percent interest rate environment pushing central banks into dangerous and unchartered waters (i.e., Japans infinite QE and the Fed’s QE)-US demographic shifts (Millennials not house hunting like mom and dad)-Cracks in financially backed political structure

      There are many other things and the global markets are simply waking up to this. The trends from the charts above are clear. The homeownership rate dropping seems to be a trend that will continue short of the economy bouncing back. Of course you have your late lemmings buying homes at top price only to realize they’ve locked into a 30 year commitment for a crap shack. L.A. County is home to the most unaffordable real estate market in the world and some people pretend this is happening because of some sacred financial blessing. These people like Bernanke in 2007 act as if things can’t change quickly. I think global markets are showing that things can and will.

      We are now in a global boom and bust system where the booms and busts seem to happen at more regular intervals.


      The US Economy Is Not Awesome And It’s Not Decoupled (aka the media RE Construct)

      by David Stockman


      When the bubble vision stock peddlers get desperate, they talk de-coupling. So by the end of today’s bloodbath you would have thought China was on another planet, and that “commodities” were some trinket-like collectibles gathered by people who don’t wear long pants, drink coca cola or jabber on their cell phones.

      On these fine shores, of course, its all awesome from sea to shinning sea. So don’t be troubled. Buy the dip.

      Never mind that we are in month 74 of this so-called recovery and that after year upon year of promised “escape velocity” the reliable signs of said event are still few and far between. But the recovery narrative stays alive because there is always some stray factoids of seasonally maladjusted, yet-to-be-revised “incoming data” that can excite the MSM headline writers and bubble vision talking heads.

      Today the data on construction spending and housing took their turn in the awesome circle. Thank heavens that the headline writing software used by the financial press doesn’t yet read graphical data. Otherwise they might have reported that private residential construction soared in July—–well, all the way back to January 2002 levels!

      And those are the nominal dollars that the Fed has done its level best to depreciate in the 13 years since then. In fact, on an inflation-adjusted basis the housing construction spend is still at 1992 levels.


      What had the headline software giddy, of course, was the year over year comps, which were in double digits. Yet did the talking heads bother to note the deep hook in last summer’s data?

      No they didn’t. Otherwise they might have seen that the two-year stack in July came in at a hardly fulsome 3.7% annual rate and that nominal private housing spending is still 7% below December 2007 and 43% below the early 2006 peak.

      More importantly, they might have noticed that this is no longer your grandfather’s housing market. The US housing stock got way over-built during the Greenspan bubble and the incoming generation of home-buyers has gotten buried in $1.2 trillion of student debt.

      So notwithstanding the mini-boom in multi-family apartment construction, the $380 billion annual rate of spending in July amounted to only 2.1% of GDP. That’s the same rock bottom ratio registered in July 2013, and is clear evidence that the housing needle has not really moved at all.

      Indeed back in January 2002 when the $380 billion annualized mark was first crossed, housing construction accounted for 3.7% of GDP, and during much of the prior two decades it had posted at 4-5% of GDP.

      In short, housing has been sent back to the minor leagues as a GDP contributor and, even then, may be soon running out of gas. The apartment construction boom was partially driven by tax credits, which have expired. And despite the periodic bursts of hopium from Wall Street analysts, there is no sign that the kids are moving out of mom and pops basement or that single family starts are breaking out of the sub-basement of history.


      In fact, the phony booms of bubble finance cast a long shadow of recoupment on future history. In the case of commercial construction of malls, shops, hotels and office buildings that retraction is especially evident. The modest recovery from the thundering plunge after the financial crisis has already lost its steam—–with the July spending level for this sector essentially flat versus prior year.

      More to the point, however, commercial construction spending last month posted at a level first crossed in February 1999. Given that the most inflation indices have risen by about 40% during the interim, the shrinkage in real terms has been tremendous.

      Yet with vacancy rates still at quasi-recession levels and malls being devastated by Amazon and e-commerce, the likelihood that the recent downward hook in commercial construction will rebound any time soon is somewhere between slim and none.


      When the totality of private nonresidential construction is considered the pattern becomes dispositive. Yes, the year-over-year number looks healthy at first glance, but it was flattered by last year’s dip and has gone nowhere on a net basis since the pre-crisis peak.

      In fact, the real story is dramatically evident in the graph below. During the 1990s recovery cycle, nominal private nonresidential construction spending surged by 75%. Then in the Greenspan housing boom cycle the gain decelerated to 43%. Alas, during the last eight years the gain has been exactly 0%.

      Even then most of the rebound from the 2009 bottom has been accounted for by energy, materials processing industries and manufacturing——-all of which are now facing the severe headwinds of global deflation.


      The talking heads also claim that jobs are springing back and this trend is certain to fuel a resurgence of consumer spending. Once again the apparent connotation is that the US economy is decoupled because the ever reliable consumers of America will shop their way through whatever disturbances may be emanating from foreign shores.

      Needless to say, that’s the same old Jobs Friday razzmatazz based on a census count that is inflated by part-time job slots in restaurants, bars and beach resorts and other new style work gigs, not full-time employment at a living wage.

      But the relevant measure is hours worked and compensation paid for those hours. In neither case is there any reason to believe that escape velocity is anywhere on the horizon.

      The index of hours worked in the nonfarm business sector posted at 110.6 during Q2 2015——a level that was virtually identical to that of Q2 2007. An economy that has spent eight years going nowhere on a net basis is just plain unlikely to get up and start sprinting at any time soon.


      The same story is told by the numbers for wage and salary compensation. Since the pre-crisis peak in July 2008, wage and salary compensation has grown at a 2.5% rate. That represents a sharp deceleration from the 4.3% rate of the prior seven year expansion.

      Even when adjusted for inflation, it is starkly evident that US wage and salary workers are not earning themselves into anything that resembles a consumption spending boom. In fact, aggregate real wages and salaries have grown at just 0.5% per year since the crisis, or at barely one-third the real rate of the previous business expansion, and there has been no sign of significant acceleration as the current recovery cycle has aged.


      US Wages and Salaries data by YCharts

      What has happened, however, is that the household savings rate has been drawn back down to historically rock bottom levels, meaning that consumption spending has nowhere to go except down if the current modest rate of wage and salary growth should falter.


      But that’s exactly the risk at hand. The export sector of the US economy is already faltering; the boom in the domestic oil and gas industry is going stone cold; capital spending has no reason to accelerate; and business inventories have reached dangerously high levels.

      In this regard the bubble vision mantra is that the American economy mostly consists of homespun goods and imports. At just 12% of GDP exports are not such a big deal, and pale compared to say Korea at 50% or China at 25%.

      But that bland assurance fails to embrace the cardinal principle that things economic happen on the margin, not the average. And on the margin world trade has already rolled-over into negative territory.

      At the same time, the central thrust of the mini-export boom after the recession was in energy products and processed materials, which have run smack into the tide of global deflation and are now heading sharply south. Accordingly, shipments are already down 18% in nominal terms from their Q3 2014 peak; have now broken below their 2008 peak; already and are heading much lower.


      As it happens, there is nothing in the US export slate to counteract this faltering trend. On an overall basis, US exports have already roll-over and now stand just 10% above their pre-recession peak. Going forward they will be a drag on economic growth, not a stimulant.


      Accordingly, if inventory liquidation begins this quarter or the next as seems increasingly likely, the last prop on the expansion will be pulled out.
      Last edited by don; September 02, 2015, 06:55 AM.

      Comment


      • Re: The Ownership Society

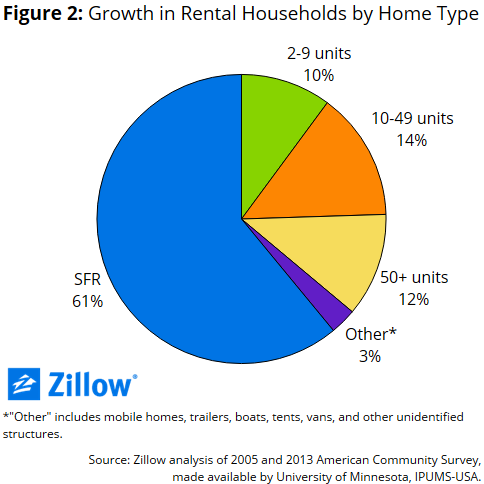
        2005-2015 Household Increases Due to Rental Households


        Comment

        Working...
        X