Announcement

Collapse
No announcement yet.

A Tale of Two Economies...

Collapse
X
 
  • Filter
  • Time
  • Show
Clear All
new posts

  • Re: A Tale of Two Economies...

    Originally posted by santafe2 View Post
    With the top two markets cratering in value it doesn't look good long term for Canadian export markets.
    We are changing to an import market. Mostly imported US$ buying Canadian assets, which look very cheap.

    A little anecdote. I was in the field earlier this week and spoke to the owner of my primary trucking contractor. He said he went to a Ritchie Bros. equipment auction in Edmonton recently looking to see if he could buy a few highway tractors at good prices. Told me almost all of them went for "near new" prices. I suggested to him the likely explanation was rooted in the statistic that North American truck manufacturers currently have the largest backlog of orders since before the 2008/09 financial crisis. US trucking firm owners are probably up here in Canada buying good used equipment "cheap" with the strong US$ because they can't wait for deliveries of new trucks next year.

    Despite the constant doomer droning, the US economy would seem to doing reasonably well in many respects. Companies don't order new trucks if they think a recession is imminent...
    Comment


    • Off the Yellow Brick Road

      The Fed and other major central banks of the world essentially have sought to “delete” from the casino narrative any and all real world factors that brought the domestic and world economies to their knees in the fall of 2008. But what they have accomplished instead is a monumental falsification of prices in virtually every asset class that is traded or not traded. So doing, they have divorced the financial market from the real economy nearly everywhere on the planet.

      Now that was fast!

      When I posted a piece a week ago noting that the S&P 500 had crossed the 2100 line from below for the 13th time this year, it signified that the market had been thrashing sideways since February 13th. Perhaps that was an omen, but technically speaking it was just further proof that the stock market is driven by Fed-following day traders and algos that reflexively buy the dips.

      But on Thursday and Friday last week, the casino gamblers got a rude awakening. Not only did they lose their lunch in a violent plunge during the last half-hour of trading two days in a row, but they also gave back another seven months of gains, as well as the crucial chart points that have kept the robo-machines aggressively buying the dips for the past six years.

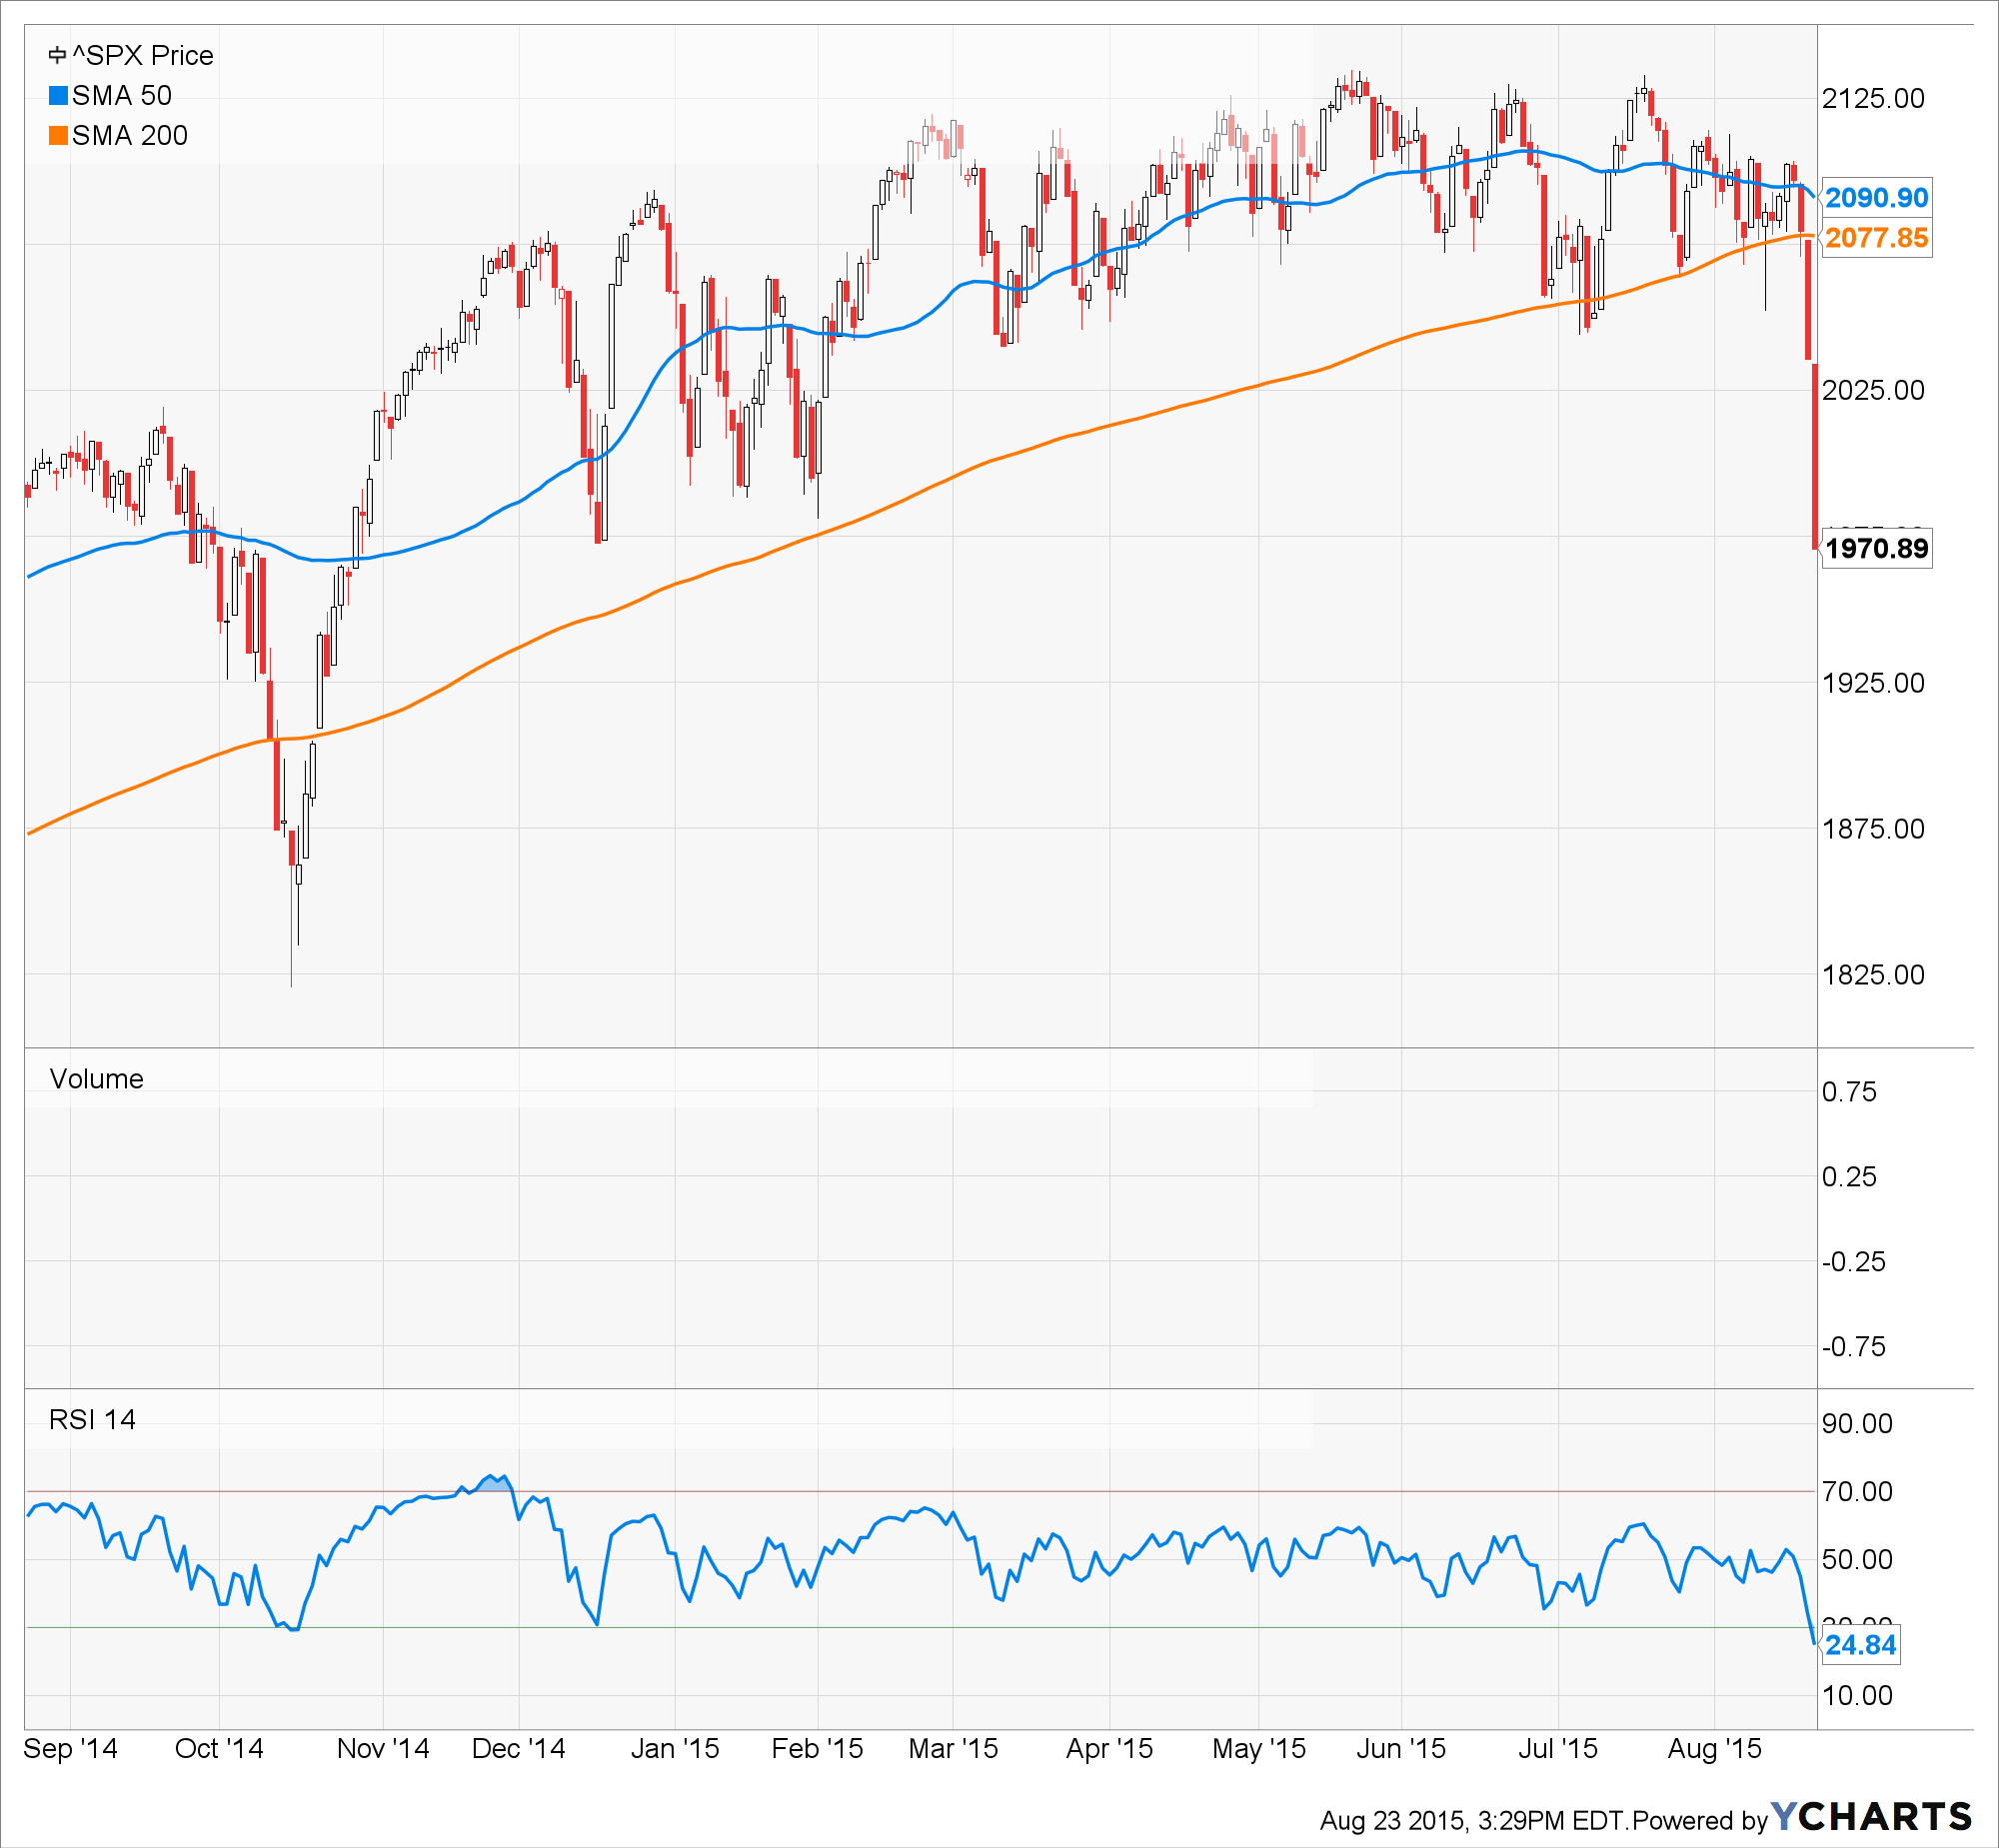
      As shown below, the S&P 500 has now retreated to the level it first crossed nearly 14 months ago on July 1, 2014; and it has also sliced through both the 50-day and 200-day moving averages like a hot knife through butter.

      Worse still, in Monday’s pre-market futures the SPX is down another 60 points. If that holds, the market will be down 10% from its May 21 peak and off nearly 8% from its 200-DMA. The latter is double the short-lived 4% swoon back on October 15.


      ^SPX data by YCharts

      That all adds up to some kind of carnage, but don’t think the dip buyers are all done. As Doug Short demonstrated in his weekend chart updates, last Friday’s plunge brought the SPX down from its May peak by exactly the 7.4% drop which occurred last October.

      That sell-off, however, was instantly reversed when one of the Fed’s most consistently inconsistent empty suits, Governor James Bullard, averred that perhaps it was time to consider an extension of QE within days of its actual ending. Upon that signal, the machines raged violently, taking the index up to 2050 or nearly 7% during the next 30 trading days.


      So expect some bullardization from the Eccles Building any day now—-perhaps when Ben Bernanke’s PhD advisor, and now Vice-Chairman of the Fed, Stanley Fischer, explains to a shell-shocked audience at Jackson Hole that we’re not there yet!

      That’s right. This ridiculous academic pettifogger and cowardly monetary apparatchik will likely tell the oh so serious financial crème de crème gathered there that we are well short of the Fed’s magic 2% on the PCE deflator, and, therefore, the time may possibly not be quite ripe—not just yet—– for “lift-off”.

      That notion is unspeakably duplicitous, destructive and self-serving. The Fed will likely defer the September rate increase not because there is too little inflation, but because it is scared silly about the kind of stock market hissy fit that is going on at this very moment. In truth, every bus driver and retired postman in America knows that main street has been “blessed” with a surfeit of inflation for as long as any ordinary citizen can remember.

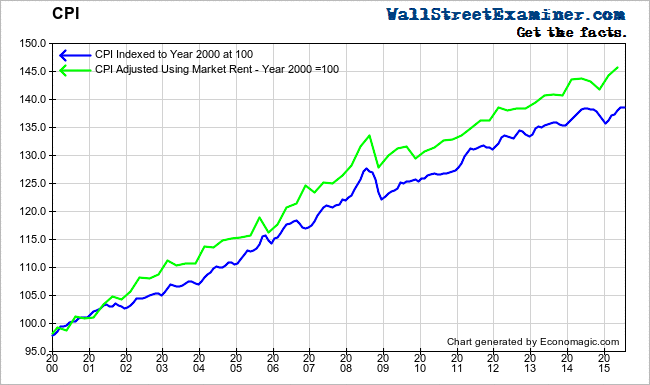
      Just in the 15 years of this century, the price level has risen by 39% or about 2% per year if you credit the BLS’ deliberately tranquilized CPI, and by 2.5% annually if you use an honest measure of cumulative housing and rent inflation.

      That the measured inflation rate in the last few months is running below that well-established trend level due to the self-evident collapse of oil and other commodities is completely irrelevant. Zero interest rates can do exactly nothing about a ferocious global deflation that was actually caused by the massive malinvestment generated by years of zero interest rates and central bank financial repression.

      So the Fed is keeping its foot planted squarely on the neck of savers and retirees for the contemptible purpose of keeping the Wall Street gamblers in free carry trade money, thereby hoping to trigger another stock market up-leg in its misbegotten campaign to generate economic growth by showering the 1% with fantastic “wealth effect” windfalls.


      Yet notwithstanding its sheer humbuggery, any such Fed confected headline is likely to catalyze another face-ripping frenzy of dip buying, accompanied by a chorus of Wall Street pitchmen announcing that the market has bounced off “support”, and the bull is ready for another upward sprint.

      Do not buy this dip, even the crater now forming. It does not represent “value”; it embodies a nasty trap owing to the unfolding collapse of the worldwide central bank driven financial bubble that has been expanding for more than two decades.

      Too be sure, we have been at this juncture before——exactly seven times since the March 2009 bottom. At the time, one of Wall Street’s most astute and sober minded traders, Doug Kass, called 666 on the S&P 500 a “generational bottom”.

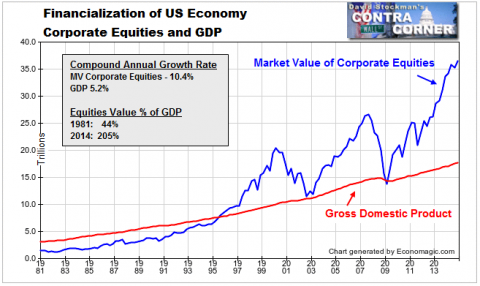
      Needless to say, that was a prescient call. Being long has never before in recorded history generated so much paper wealth so consistently and in such a relatively brief period of time. To wit, the Wilshire 5000 basket of US stocks alone gained more than $15 trillion of market cap during the last six years; and the total value of all corporate equity in the US economy, as tabulated by the Fed’s flow-of-funds report, soared by more than $20 trillion, thereby substantially outpacing the two earlier stock market bubbles.


      Here’s the skunk in the woodpile, however. Those gigantic gains had virtually nothing to do with the long-term trends in the US economy, which have been punk, at best. Instead, the soaring stock averages and booming trading accounts since the March 2009 bottom were fueled by a monumental monetary reflation.

      The Fed and other major central banks of the world essentially have sought to “delete” from the casino narrative any and all real world factors that brought the domestic and world economies to their knees in the fall of 2008. But what they have accomplished instead is a monumental falsification of prices in virtually every asset class that is traded or not traded. So doing, they have divorced the financial market from the real economy nearly everywhere on the planet.
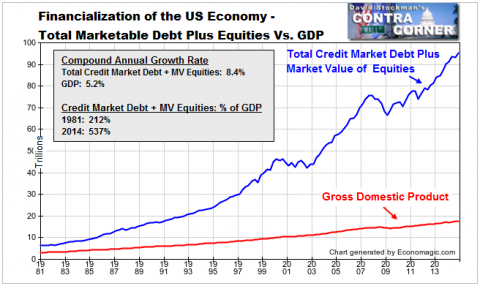
      That is the true meaning of the above chart. In fact, when total credit market debt outstanding is added to market equity the true extent of unsustainable financialization becomes readily apparent. Whereas finance outstanding amounted to $8 trillion and about 200% of GDP before 1980, it has subsequently just ripped away from its moorings in the real economy.

      During the last 35 years the value of US finance grew by 13X to $93 trillion. At the end of 2014, it represented nearly 540% of GDP. But in the great scheme of history, there is no reason why the US national income should be capitalized at any higher multiple today than it was in 1980—–given the sharp deceleration of economic growth, the baby boom retirement bomb and the debt-saturation of the public and private sectors alike.

      Even had total finance stabilized at the 240% of GDP level which was in place when Greenspan took the helm at the Fed, the blue line in the chart below would end at $43 trillion in 2014.

      So call the difference $50 trillion of excess financialization. Call it an eventual financial implosion that will bury all the robo-machines and all the gamblers tempted to buy the dip for the eighth time running.


      So what is different this time? The answer is that the post-2009 recovery was a false start. It represented a final and radical expansion of the growth and capital spending bubble that has been underway around the world since the early 1990s.

      In effect, rather than allowing the earlier artificial booms driven by massive household credit expansion in the US and Europe to be liquidated, developed market central bankers drove interest rates to the zero bound in a foolish quest to jump-start consumption spending by debt-saturated households.

      But this did not cause consumers to spend more in the US or Europe because the vast middle classes of these developed market economies were already at “peak debt”. Instead, it generated a madcap scramble for yield among money managers and an eventual capital outflow of $4-5 trillion into emerging market debt markets.

      Taken together, the combination of unprecedented financial repression in developed market capital markets and the prodigious expansion of domestic business credit in China and the emerging market elicited a tidal wave of capital investment unlike the world has ever witnessed. According to the computations of Thompson Reuters Datastream for all publicly listed companies on a worldwide basis, global CapEx grew from about $500 billion per year in 1995 to $2.5 trillion annually at the peak in 2013.

      That stupendous 5X gain is at the heart of the global malinvestment boom. It not only left the world drowning in excess oil, mining, ship-building, manufacturing, shipping, warehousing and distribution capacity, but also created a false chain of income multipliers. That’s because a capital spending boom of this magnitude—— fueled by cheap, falsely priced capital—–is initially accompanied by enormous windfall profits on existing capacity and booming production, wages, profits and vendor contracts among suppliers of new equipment, facilities and infrastructure.

      Since 2013, however, the massive capital spending bubble driven by central bank policy has begun to roll-over—–even as the lagged effect of the project completion cycle has temporarily braked the fall. Accordingly, excess capacity continues to build, meaning that the cliff-diving phase of commodity and industrial prices and profit margins has just begun, and that worldwide capital spending will be plunging sharply southward for years to come.

      And that means, in turn, that the chain of income multipliers which has inflated profits, wages and bonuses all over the world in the capital goods industries will now violently reverse direction. That not only means that the Chinese and Korean shipyards will soon be bankrupt and that Australia and Brazil are heading for depression, but also that the upstream waves will make a mockery of the US “de-coupling” myth peddled by Wall Street. CAT is as good a short as is China and the European luxury brands which have thrived on Beijing’s Red Ponzi.

      So now comes the era of gluts, shrinking profits and a drastic deflation of the giant financial bubble that the world’s central banks have so foolishly generated. And this time they will be powerless to stop the carnage.

      Yet the beleaguered central bankers will launch desperate verbal and market manipulation ploys to brake the current sell-off and thereby preserve the bloodied remnants of their handiwork. When in response the gamblers make their eighth run at buying a dip that is now rapidly turning into a crater, it will be an excellent time to sell anything in the casino that isn’t nailed down.

      It is well and truly possible that 2130 on the S&P 500 will prove to be the opposite of Doug Kass’ epigrammatic pronouncement. That is, a generational high. Every time the market attempts to climb back into the 2050-2130 zone, it will likely be meet with another shoe falling in the global economy.

      Moreover, in the context of the great global deflation and capital goods depression now unfolding, negative economic news will now be seen for what it is—–a confirmation that the great 20-year central bank driven bubble is over, and that inflated incomes and profits will be coming back to earth.

      Still, the generation of traders and robo-machines that have so stupendously harvested from the dips after Kass’ generational bottom will by no means be reconciled to the end of the game. They will be eager buyers of calls near the generational top.

      Take their premiums whenever the old tops are near. The opportunities are plentiful, starting with Janet Yellen’s favorite short, the NASDAQ Biotech Index:


      David Stockton

      Comment


      • Re: Off the Yellow Brick Road
        “Not only is the equity market at the second most overvalued point in U.S. history, it is also more leveraged against probable long-term corporate cash flows than at any previous point in history.”
        — John P. Hussman, Ph.D. “Debt-Financed Buybacks Have Quietly Placed Investors On Margin“, Hussman Funds

        “This year feels like the last days of Pompeii: everyone is wondering when the volcano will erupt.”
        — Senior banker commenting to the Financial Times

        Last Friday’s stock market bloodbath was the worst one-day crash since 2008. The Dow Jones dropped 531 points, while the S&P 500 fell 64, and the tech-heavy Nasdaq slid 171. The Dow lost more than 1,000 points on the week dipping back into the red for the year. At the same time, commodities continued to get hammered with oil prices briefly dropping below the critical $40 per barrel mark. More tellingly, the market’s so called “fear gauge” (VIX) skyrocketed to a 2015 high indicating more volatility to come. The VIX has remained at unusually low levels for a number of years as investors have grown more complacent figuring the Fed will intervene whenever stocks fall too far. But last week’s massacre cast doubts on the Central Bank’s intentions. Will the Fed ride to the rescue again or not? To the vast majority of institutional investors, who now base their buying decisions on Fed policy rather than market fundamentals, that is the crucial question.

        Ostensibly, last week’s selloff was triggered by China’s unexpected decision to devalue its currency, the juan. The announcement confirmed that the world’s second biggest economy is rapidly cooling off increasing the likelihood of a global slowdown. Over the last decade, China has accounted “for a third of the expansion in the global economy,… almost double the contribution of the US and more than triple the impacts of Europe and Japan.” Fears of a slowdown were greatly intensified on Friday when a survey showed that manufacturing in China shrank at the fastest pace since the recession in 2009. That’s all it took to put the global markets into a nosedive.

        “The deceleration of growth in China, reflected in figures on production, exports and imports, business investment and producer prices, is fueling a near-collapse in so-called “emerging market” economies that depend on the Chinese market for exports of raw materials. The past week saw a further plunge in stock prices and currency rates in Russia, Turkey, Brazil, South Africa and other countries. These economies are being hit by a massive outflow of capital, placing in doubt their ability to meet debt obligations.”


        While a correction was not entirely unexpected following a 6-year long bull market, the sudden drop in equities does have analysts rethinking the effectiveness of the Fed’s monetary policies which have had little impact on personal consumption, retail spending, wages, productivity, household income, or economic growth all of which remain weaker than they have been following any recession in the post war era. For all intents and purposes, the plan to inflate asset prices by dropping rates to zero and injecting trillions in liquidity into the financial system has been an abject failure. GDP continues to hover at an abysmal 1.5% while signs of a strong, self sustaining recovery are nowhere to be seen. At the same time, government and corporate debt continue to balloon at a near-record pace draining capital away from productive investments that could lay the groundwork for higher employment and stronger growth.


        What’s so odd about last week’s market action is that the bad news on China put shares into a tailspin instead of sending them into the stratosphere which has been the pattern for the last four years. In fact, the reason volatility has stayed so low and investors have grown so complacent is because every announcement of bad economic data has been followed by cheery promises from the Fed to keep the easy-money sluicegates open until the storm passes. That hasn’t been the case this time, in fact, Fed chair Janet Yellen hasn’t even scrapped the idea of jacking up rates some time in September which is almost unthinkable given last week’s market ructions.

        Why? What’s changed? Surely, Yellen isn’t going to sit back and let six years of stock market gains be wiped out in a few sessions, is she? Or is there something we’re missing here that is beyond the Fed’s powers to change? Is that it?

        My own feeling is that China is not the real issue. Yes, it is the catalyst for the selloff, but the real problem is in the credit markets where the spreads on high yield bonds continue to widen relative to US Treasuries.

        What does that mean?

        It means the price of capital is going up, and when the price of capital goes up, it costs more for businesses to borrow. And when it costs more for businesses to borrow, they reduce their borrowing, which decreases the demand for credit. And when the demand for credit decreases in a credit-based system, then there’s a corresponding slowdown in business investment which impacts stock prices and growth. And that is particularly significant now, since the bulk of corporate investment is being diverted into stock buybacks. Check out this excerpt from a post at Wall Street on Parade:

        “According to data from Bloomberg, corporations have issued a stunning $9.3 trillion in bonds since the beginning of 2009. The major beneficiary of this debt binge has been the stock market rather than investment in modernizing the plant, equipment or new hires to make the company more competitive for the future. Bond proceeds frequently ended up buying back shares or boosting dividends, thus elevating the stock market on the back of heavier debt levels on corporate balance sheets.


        Now, with commodity prices resuming their plunge and currency wars spreading, concerns of financial contagion are back in the markets and spreads on corporate bonds versus safer, more liquid instruments like U.S. Treasury notes, are widening in a fashion similar to the warning signs heading into the 2008 crash. The $2.2 trillion junk bond market (high-yield) as well as the investment grade market have seen spreads widen as outflows from Exchange Traded Funds (ETFs) and bond funds pick up steam.” (“Keep Your Eye on Junk Bonds: They’re Starting to Behave Like ‘08 “, Wall Street on Parade)


        As you can see, the nation’s corporations don’t borrow at zero rates from the Fed. They borrow at market rates in the bond market, and those rates are gradually inching up. And while that hasn’t slowed the stock buyback craze so far, the clock is quickly running out. We are fast approaching the point where debt servicing, shrinking revenues, too much leverage, and higher rates will no longer make stock repurchases a sensible option, at which point stocks are going to fall off a cliff. Here’s more from Andrew Ross Sorkin at the New York Times:

        “Since 2004, companies have spent nearly $7 trillion purchasing their own stock — often at inflated prices, according to data from Mustafa Erdem Sakinc of the Academic-Industry Research Network. That amounts to about 54 percent of all profits from Standard & Poor’s 500-stock index companies between 2003 and 2012, according to William Lazonick, a professor of economics at the University of Massachusetts Lowell.”


        You can see the game that’s being played here. Mom and Pop investors are getting fleeced again. They’ve been lending trillions of dollars to corporate CEOs (via bond purchases) who’ve taken the money, split it up among themselves and their wealthy shareholder buddies, (through buybacks and dividends neither of which add a thing to a company’s productive capacity) and made out like bandits. This, in essence, is how stock buybacks work. Ordinary working people stick their life savings into bonds (because they were told “Stocks are risky, but bonds are safe”.) that offer a slightly better return than ultra-safe, low-yield government debt (US Treasuries) and, in doing so, provide lavish rewards for scheming executives who use it to shower themselves and their cutthroat shareholders with windfall profits that will never be repaid. When analysts talk about “liquidity issues” in the bond market, what they really mean is that they’ve already divvied up the money between themselves and you’ll be lucky if you ever see a dime of it back. Sound familiar?


        Of course, it does. The same thing happened before the Crash of ’08. Now we are reaching the end of the credit cycle which could produce the same result. According to one analyst:

        “There’s been worrying deterioration in the overall global demand picture with the continuation of EM (Emerging Markets) FX (Currency Markets) onslaught, deterioration in credit metrics with rising leverage in the US as well as outflows in credit funds in conjunction with significant widening in credit spreads…..The goldilocks period of “low rates volatility-stable carry trade environment of the last couple of years is likely coming to an end.”

        (“Credit: Magical Thinking“, Macronomics)

        In other words, the good times are behind us while hard times are just ahead. And while the end of the credit cycle doesn’t always signal a stock market crash, the massive buildup of leverage in unproductive financial assets like buybacks suggest that equities are in line for a serious whooping. Here’s more from Bloomberg:

        “Credit traders have an uncanny knack for sounding alarm bells well before stocks realize there’s a problem. This time may be no different. Investors yanked $1.1 billion from U.S. investment-grade bond funds last week, the biggest withdrawal since 2013, according to data compiled by Wells Fargo & Co…..

        “Credit is the warning signal that everyone’s been looking for,” said Jim Bianco, founder of Bianco Research LLC in Chicago. “That is something that’s been a very good leading indicator for the past 15 years.”

        Bond buyers are less interested in piling into notes that yield a historically low 3.4 percent at a time when companies are increasingly using the proceeds for acquisitions, share buybacks and dividend payments. Also, the Federal Reserve is moving to raise interest rates for the first time since 2006, possibly as soon as next month, ending an era of unprecedented easy-money policies that have suppressed borrowing costs….

        “Unlike the credit market, the equity market well into 2008 was very complacent about the subprime crisis that led to a full blown financial crisis,” the analysts wrote…..

        So if you’re very excited about buying stocks right now, just beware of the credit traders out there who are sending some pretty big warning signs.” (“U.S. Credit Traders Send Warning Signal to Rest of World Markets”, Bloomberg)

        It’s worth noting that the above article was written on August 14, a week before the stock market blew up. But credit was “flashing red” long before stock traders ever took notice.


        But that’s beside the point. Whether the troubles started with China or the credit markets, probably doesn’t matter. What matters is that the system about to be put-to-the-test once again because the appropriate safeguards haven’t been put in place, because bubbles are unwinding, and because the policymakers who were supposed to monitor and regulate the system decided that they were more interested in shifting wealth to their voracious colleagues on Wall Street than building a strong foundation for a healthy economy. That’s why a simple correction could turn into something much worse.


        NOTE: As of posting time, Sunday night, the Nikkei Index is down 710, Shanghai down 296, HSI down 1,031. US equity futures are all deep in the red


        MIKE WHITNEY lives in Washington state. He is a contributor to Hopeless: Barack Obama and the Politics of Illusion (AK Press).

        Comment


        • Re: Off the Yellow Brick Road

          if this had been Shanghai . . .


          Earlier today, as AAPL stock was plummeting and had lost a whopping $75 billion in market cap, dropping as low as $92/share, CNBC's Jim Cramer pulled a rabit out of a hat, or in this case a previously undisclosed email out of his inbox. An email from AAPL CEO Tim Cook which said the following (as subsequently conveyed by Cramer to CNBC viewers):


          Jim,

          As you know, we don't give mid-quarter updates and we rarely comment on moves in Apple stock. But I know your question is on the minds of many investors.

          I get updates on our performance in China every day, including this morning, and I can tell you that we have continued to experience strong growth for our business in China through July and August. Growth in iPhone activations has actually accelerated over the past few weeks, and we have had the best performance of the year for the App Store in China during the last 2 weeks.

          Obviously I can't predict the future, but our performance so far this quarter is reassuring. Additionally, I continue to believe that China represents an unprecedented opportunity over the long term as LTE penetration is very low and most importantly the growth of the middle class over the next several years will be huge.

          Tim

          While we are delighted by Tim Cook's subjective take of AAPL's Chinese prospects, we have a different question: where is the public filing that accompanies this letter which constitutes nothing short of a private business update with an outside, and unregulated by Apple, market cheerleader?

          Because as the AAPL reaction to Tim's letter, which was clearly in Cramer's private possession for at least 1 millisecond before it was made public (and thus we don't know who else may have had access to it before its public dissemination), just how is this not a Regulation Fair Disclosure violation?

          Needless to say, the fate of AAPL, which is the most important stock in the world, held by a record 181 hedge funds, determines the intraday (and not only) fate of the entire market.


          And for those who may have missed it, this is what AAPL's stock has done today, ever since this clearly market moving letter, helped AAPL regain an unprecedented $80 billion in market cap since the lows.

          Comment


          • Re: Off the Yellow Brick Road

            Markets Dive: Keep Your Eyes on Wall Street Bank Stocks

            By Pam Martens and Russ Martens: August 24, 2015


            Trading in Citigroup (Green) Versus Dow Jones Industrial Average (Orange), Friday, August 21, 2015

            After an 8.5 percent plunge in China’s Shanghai Composite Index on Monday (bringing its loss for the month to a negative 21 percent), a drop in the U.S. Dollar and the U.S. crude oil benchmark, West Texas Intermediate, slipping below $39 a barrel, futures on the Dow Jones Industrial Average at 8:27 a.m. are flashing an ugly opening in New York, with a potential loss of as much as 648 points. (That could materially change before the market opens at 9:30 a.m.)

            Mainstream media seem obsessed with what actions the central bank of China might take to stem the rout while also focused on debating if this means a rate hike from the Fed is off the table. The Fed, unfortunately, can only talk about hiking or not hiking since it’s fired all its bullets and has no rate cuts to offer should the U.S. economy need a monetary boost.

            What no one seems to be talking about is the serious drubbing the shares of the too-big-to-fail Wall Street banks took on Thursday and Friday of last week. That’s not something that should be swept under the rug when markets are behaving like the early days of the last financial crisis in 2008 — which saw the largest Wall Street bank bailouts in history.

            While the stock losses of the largest Wall Street banks were manageable last Thursday, they picked up steam on Friday. What was particularly surprising was that JPMorgan’s losses were on a par with those of Citigroup, with Citigroup shares losing 6.06 percent in the two day period while JPMorgan was off by 6.01 percent. Bank of America, which owns the giant Wall Street stock brokerage firm, Merrill Lynch, lost 7.95 percent in the two-day span.

            Citigroup is under a criminal investigation for potential money laundering in connection with its Mexican unit, Banamex, after admitting to a felony for foreign currency rigging earlier this year. One would think the investigation would cause its shares to trade at a significant deficit to JPMorgan Chase during a market rout.

            Not to put too fine a point on it, but Citigroup is also the mega Wall Street bank that sucked more out of the taxpayers’ purse during the 2008 crash than any other bank in U.S. history. Citigroup received $45 billion in equity infusions, over $300 billion in asset guarantees and more than $2.5 trillion, cumulatively, in below-market-rate loans from the Federal Reserve – all to prop up a bank that continues to this day to pay fines for malfeasance and cartel activity.

            The chart above shows how Citigroup traded on Friday versus the Dow Jones Industrial Average – an index of 30 of the largest companies in the world: companies like Exxon, Coca-Cola, Boeing and Procter and Gamble.

            On Friday, when the Dow closed with a loss of 531 points, Citigroup opened at $54.40 and closed at $53.60, a loss of 3.13 percent. But Citigroup made three unusual spikes during the day that were aberrational with what was going on in the broader market. We’ve noted those periods with a yellow circle on the chart above.

            The most unusual move came at 2 p.m. when the Dow was deeply in red territory. Citigroup, which had opened at $54.40, traded at a high of $55.05 – levitating itself and shaking off the overwhelming negative financial news ricocheting around the globe. We’ll leave it to others to speculate on just who was buying Citigroup during those unusual spikes.

            For years, Senator Elizabeth Warren and many others have been calling for real financial reform on Wall Street, including reinstatement of the Glass-Steagall Act which would separate banks holding taxpayer-backed insured deposits from Wall Street’s high-risk trading houses – putting a true end to too-big-to-fail. Tragically, we now find ourselves in the midst of a full-blown market panic with much of the financial reform of Wall Street left to the work of a future, more courageous Congress and President.

            Comment


            • Re: Off the Yellow Brick Road

              Michael Hudson on the market correction . . . .

              Comment


              • You Mean There's Consequences!

                Forget China, Here’s What’s Really Frightening U.S. Stock Investors

                By Pam Martens and Russ Martens: August 26, 2015

                Wall Street has tried to keep all eyes focused on the ongoing rout in China’s stock markets and away from the slowdown in both earnings and revenues in the Standard and Poor’s 500 index of the largest U.S. corporations. In remarks yesterday, Sam Stovall, Managing Director of U.S. Equity Strategy for S&P Capital IQ said that among the growing concerns are “a possible U.S. profit recession.”

                Last evening, Bloomberg Business reported that “Profits reported by S&P 500 companies in the second quarter fell 2 percent from a year ago and are projected to slip 5.5 percent in the current period.”

                As earnings and revenues slide, the corporate balance sheets bloated with debt taken on to buy back the company’s own shares will provide an unwelcome headwind to grow earnings. Since 2009, S&P 500 corporations have spent over $2 trillion buying back their own stock.

                According to the U.S. Treasury’s Office of Financial Research in a report released in March, “corporate debt outstanding has risen to $7.4 trillion, up from $5.7 trillion in 2006,” noting that a significant portion of that was spent on share buybacks. The report goes on to note that “Although this financial engineering has contributed to higher stock prices in the short run, it detracts from opportunities to invest capital to support longer-term organic growth. Credit conditions remain favorable today because of the positive trend in earnings, but once the cycle turns from expansion to downturn, the buildup of past excesses will eventually lead to future defaults and losses.”

                Further angst on Wall Street stems from worries about just how the U.S. mega banks might fare in a market meltdown. As we reported in June, some of the largest banks are back to their dodgy practices, this time entering into “capital relief trades” with questionable counter parties like hedge funds and private equity firms. The capital relief trades allow the banks to enter into derivative trades that dress up the appearance of stronger capital while keeping the deteriorating assets on their books.


                The Office of Financial Research (OFR) released a report on the practice in June and suggested these derivatives deals may present systemic risk to the financial system. What was particularly stunning about the report is that it directly linked the current behavior to the same type of behavior as that which collapsed the economy in 2008.


                The OFR report referenced a memo that was disclosed by the Financial Crisis Inquiry Commission, charged with investigating and reporting on the underlying causes of the 2008 Wall Street collapse.

                That memo was transmitted on September 16, 2008 – a day after Lehman Brothers had filed for bankruptcy. The memo was attached to an email to Tim Geithner, then President of the New York Fed. One section of the memo detailed what AIG, the giant international insurance company headquartered in the U.S., had been doing with European banks to dress up their capital. The memo said AIG had engaged in swaps that allowed European banks to hold “1.6% in regulatory capital as opposed to 8%.”

                AIG was also on the hook for Credit Default Swaps purchased by Wall Street banks like Goldman Sachs and required a $185 billion taxpayer bailout to remain afloat.


                One of the mega banks that is currently engaging in these capital relief trades is Citigroup, the recipient of the largest bank bailout in U.S. history during the 2008 crash. According to a February 2013 report at Bloomberg Business, Citigroup entered into a deal with private-equity firm, Blackstone Group. Citigroup obtained from Blackstone protection against initial losses on $1.2 billion of shipping loans, which allowed Citigroup to lower the amount of capital it had to set aside by 96 percent. According to Bloomberg, the loans remained on Citigroup’s balance sheet.

                Comment


                • Re: You Mean There's Consequences!


                  Jim Grant

                  Comment


                  • Safe Havens?

                    Defining a Market Bubble: 5 U.S. Stocks Worth $1.88 Trillion and One of Them Can’t Figure Out How to Make Money


                    By Pam Martens and Russ Martens: August 27, 2015


                    Capital Dynamics Founder and CEO, Tan Teng Boo


                    That big so-called rally at the market close yesterday was not a rally but a short squeeze. That’s when the hedge funds that have put on short positions size up the amount of stock for sale at the close of trading and, if the amount is light, they decide to close out their short positions by buying stock to cover. On Tuesday, there was approximately $3.5 billion in orders to sell at the close, resulting in the late day selloff. Yesterday, there was only about $500 million to sell, making it risky to hold short positions, thus the short squeeze driving the Dow up 619 points at the close.

                    Expect to see a lot more of these spikes, up or down, in the last two hours of trading.

                    Assessing just how large the bubble has grown in U.S. markets as a result of the Fed’s zero-bound interest rate strategy since December 2008, Tan Teng Boo, founder and CEO of Capital Dynamics appeared on a Bloomberg Television segment this morning and summed up our new market bubble in a few words. Boo said just five U.S. stocks — Apple, Google, Microsoft, Facebook, and Amazon — are worth more than the Frankfurt, Germany stock market, which represents the fourth largest economy in the world.

                    We did the math after the past week’s selloff and yesterday’s big spike higher. At yesterday’s close, the market caps for the levitating five are as follows: Apple $625.532 billion; Google, $440.767 billion; Microsoft, $341.594 billion; Facebook, $245.795 billion and Amazon, $234.215 billion. The total market cap for the five — $1.889 trillion.

                    All five of these stocks have one thing in common: they all trade on the Nasdaq stock market. That’s the market that gave you the 2000 bust that erased $4 trillion from investors’ pockets in dot-com and tech blowups as well as the stock market that oversaw a massive price rigging cartel for more than a decade.

                    On July 17, 1996, the U.S. Justice Department charged most of the largest firms on Wall Street (iconic brands like Merrill Lynch, JPMorgan and predecessor firms to Citigroup) with price fixing on Nasdaq. The firms were deemed so untrustworthy going forward that as part of its settlement the Justice Department required that some Wall Street traders’ phone calls be tape recorded when making Nasdaq trades. The Justice Department also gave itself the right to randomly show up and listen in on the traders’ calls.

                    Today, some of the same firms that were charged with price rigging on Nasdaq have been charged with similar cartel activity in rigging the Libor interest rate benchmark and/or foreign currency trading. But that has not prevented these firms from operating their own Dark Pools, effectively unregulated stock markets, where the highfliers mentioned above are traded in darkness.

                    Wall Street On Parade previously conducted a study of trading in Apple stock in Dark Pools for the weeks of May 26 through June 23, 2014. (Until last year, data on Dark Pool trading had not been available to the public.) We reported as follows on that study in June of this year:

                    “During that period, Dark Pools traded over 103.6 million shares of Apple stock. The heaviest week was the week of June 9, 2014 when 39.9 million shares traded in dark pools. Goldman Sachs was responsible for trading 2,444,350 shares of Apple that week in its Dark Pool, Sigma-X, and has been in the top tier of dark pools trading Apple stock in all subsequent weeks of our review period. (On July 1 of last year, the self-regulator, FINRA, administered a minor wrist slap to Goldman for what was clearly very serious pricing irregularities in its dark pool.)

                    “Goldman Sachs has also been an enabler to Apple taking on debt to finance its stock buybacks. Goldman Sachs was the co-lead manager with Deutsche Bank in April of 2013 when Apple launched a $17 billion corporate debt offering in order to buy back its shares and increase its dividend. Apple’s $17 billion debt deal was the largest in corporate history at that point. Goldman was also Apple’s advisor in 1996 when the company was warding off bankruptcy and Goldman managed its $661 million convertible debt offering.

                    “Could taking on debt and buying back shares become an addiction? One year after the April 2013 $17 billion debt deal by Apple, Goldman Sachs and Deutsche Bank co-led another $12 billion debt offering for Apple in April of 2014. So far this year, Apple has issued $6.5 billion in debt in February and another $8 billion on May 6. Goldman Sachs & Co., Bank of America Merrill Lynch and J.P. Morgan were involved in Apple’s May offering, which was specifically earmarked for share buybacks and dividends.”

                    Another of the highfliers, Amazon, whose market cap is larger than AT&T, is still trying to figure out how to generate profits. Here’s a few headlines describing its struggles:

                    December 18, 2013: International Business Times: “Amazon: Nearly 20 Years In Business And It Still Doesn’t Make Money, But Investors Don’t Seem To Care”;
                    October 23, 2014: New York Times: “Amazon’s Investments Are Piling Up, as Big Losses”;

                    October 24, 2014: Bloomberg Business: “…the company yesterday posted its biggest quarterly net loss since at least 2003…”

                    As for Facebook, all you need to know is that its Price-to-Earnings Ratio (PE Ratio) is an astronomical 88.97 at yesterday’s close.

                    One of the Bloomberg Television anchors who was interviewing Tan Teng Boo, Angie Lau, noted that those five stocks had led the big rally yesterday and said “those still seem like safe haven plays.”

                    Calling Apple and Amazon and Facebook “safe haven plays” is like comparing Donald Trump to the Dalai Lama. Let’s hope American investors are smarter today than they were going into the dot.com bust in 2000 and the 2008 crash.

                    Comment


                    • Let the Market Decide

                      Government-backed egg lobby tried to crack food startup, emails show

                      USDA official joined American Egg Board in planning to ruin Hampton Creek, Silicon Valley firm that created plant-based egg alternative and Just Mayo


                      A US government-appointed agricultural body tried to crush a Silicon Valley food startup after concluding the company represented a “major threat” and “crisis” for the $5.5bn-a-year egg industry
                      .

                      In potential conflict with rules that govern how it can spend its funds, the American Egg Board (AEB) lobbied for a concerted attack on Hampton Creek, a food company that has created a low-cost plant-based egg replacement and the maker of Just Mayo, a mayonnaise alternative.

                      In a series of emails obtained under the Freedom of Information Act (Foia), AEB staff, a US department of agriculture official and egg industry executives attempted to orchestrate the attack.

                      The documents were obtained by Ryan Shapiro, a Foia expert at the Massachusetts Institute of Technology, and Shapiro’s Washington DC-based Foia-specialist attorney, Jeffrey Light, and passed to Hampton Creek.

                      Among the efforts coordinated between the AEB, the USDA and the egg industry:

                      • Outgoing AEB head Joanne Ivy advised Unilever on how to proceed against Hampton Creek after the food giant filed a false advertising lawsuit against its rival last year.
                      • The Department of Agriculture’s national supervisor of shell eggs joined the AEB in its attack on Hampton Creek, suggesting Ivy contact the Food and Drug Administration (FDA) directly about Just Mayo with her concerns. The FDA later ruled Just Mayo must change its name.
                      • The AEB attempted to have Just Mayo blocked from Whole Foods, asking Anthony Zolezzi, a partner at private equity firm Pegasus Capital Advisors and self-described “eco-entrepreneur”, to use his influence with Whole Foods to drop the product. (Whole Foods still sells Just Mayo.)
                      • More than one member of the AEB made joking threats of violence against Hampton Creek’s founder, Josh Tetrick. “Can we pool our money and put a hit on him?” asked Mike Sencer, executive vice-president of AEB member organization Hidden Villa Ranch. Mitch Kanter, executive vice-president of the AEB, jokingly offered “to contact some of my old buddies in Brooklyn to pay Mr. Tetrick a visit”.
                      • The AEB’s research arm, the Egg Nutrition Center (ENC), tested the strength of Hampton Creek’s patent for its egg replacer, Beyond Eggs, using a consultant, Gilbert Leveille. Leveille concluded that the patent was “not very strong and could be easily challenged with an alternate product”, he said in an email to Kanter. “Were I in your position I would focus on nutritional quality and on the emerging science, much of which ENC has sponsored,” Leveille wrote.


                      The emails, totalling 600 pages, show the AEB has become deeply concerned about Hampton Creek. The San Francisco-based tech company has attracted $120m in funding from some of tech’s biggest names, including the Founders Fund, started by Facebook backer Peter Thiel, and Vinod Khosla’s Khosla Ventures.

                      The AEB represents egg farmers across the US and its board is selected by the secretary of agriculture. This year the politically connected AEB provided 14,000 eggs for the White House’s annual Easter egg roll and Ivy was photographed with President Barack Obama.

                      Hampton Creek has recently signed a deal with Compass, the world’s largest catering company, and is pursuing contracts with other fast-food and food supply companies that have traditionally been held by the egg industry.

                      “Missy, I am getting a lot of emails about this product from egg producers,” Ivy wrote in an email to Missy Maher, an executive at the Edelman public relations company, in August 2013. She said it “would be a good idea if Edelman looked at this product as a crisis and major threat to the future of the egg product business”.

                      Unilever – maker of Hellman’s mayonnaise – sued Hampton Creek in November 2014, arguing Just Mayo was falsely named because it contained no eggs. Unilever dropped the suit last December. Emails show Ivy gave advice to people representing Unilever.

                      “I just got off the phone with a guy working with the Unilever case with Hampton Creek,” Ivy wrote in an email to Howard Magwire, head of government relations for the agricultural cooperative United Egg Producers.

                      “He wanted me to say that we supported Unilever in this lawsuit against Hampton Creek, but I told him that we could not take a position. However, since the regulation requires egg in mayo and the product does not, I said that they should make sure the FDA is aware to address this situation. I feel sure they are aware, but maybe they need to be pushed.”

                      The previous day, Ivy had written: “Oh, I believe I mentioned in an email yesterday that the counsel from Unilever called. If not, I am mentioning it now. I believe I provided him some basic information that was helpful but let him know that AEB cannot make statements that would support Unilever’s position.” Both emails were sent in November 2014, while the litigation between Unilever and Hampton Creek was ongoing.

                      Before the discussion with Unilever, the Department of Agriculture (USDA) had already suggested ways to put pressure on Hampton Creek. In January 2014, Roger Glasshoff, then the USDA’s head of shell eggs, told Ivy to contact the FDA about Just Mayo directly. “I would forward the information to the FDA District Office responsible for the location where the product was marketed,” Glasshoff wrote. “I believe that many labels currently in commerce do not comply with the FDA’s labeling policy.”

                      Last month the FDA ruled that Just Mayo could not be called mayonnaise because it does not contain eggs.

                      Tetrick, the Hampton Creek founder, said he found the emails “quite shocking”, but that they didn’t faze him. “I’m not entirely surprised that some industries that are lost in the past a little bit are fighting so hard,” he said. “Even though it was joking, some of those notes about putting a hit out – that’s some reckless stuff.”

                      With respect to the FDA’s instruction to change the name of Just Mayo, Tetrick said the product’s moniker was here to stay. “We don’t have any plans on changing the name,” he said. “Names matter, and they influence people. We want to connect to the everyday person who’s shopping at the Dollar Tree or shopping at Walmart.”

                      In a statement to the Guardian, Ivy said: “Anthony Zolezzi has never conducted any work on behalf of the American Egg Board; thus he was never paid for any services. The American Egg Board did not take a position on the Unilever and Hampton Creek lawsuit and did not contact the FDA regarding Just Mayo.”

                      Ivy further wrote: “At the American Egg Board, our singular focus is on supporting the American egg farmer and communicating the value of the incredible edible egg™. Eggs remain all-natural and are packed with a number of nutrients, including high-quality protein. In fact, the quality of egg protein is so high that scientists often use eggs as the standard for measuring the protein quality of other foods.”

                      With respect to Kanter’s joke about his Brooklyn buddies, Ivy said: “We are aware of the comments made by an American Egg Board employee. While these comments were clearly made in jest, they were inappropriate and do not reflect our organization’s values. We apologize for any offense.”

                      The law that created the Egg Board says that “no funds collected by the Egg Board under the order shall in any manner be used for the purpose of influencing governmental policy or action”. AEB is funded by a levy of 20 cents per case of eggs sold by its constituent members.


                      Comment


                      • Flying Down to Brazil

                        By the lights of bubblevision, Tuesday’s plunge was just a bull market “retest” of last week’s lows, which posted at 1867 on the S&P 500. As is evident below, the test was passed with 80 points to spare at today’s close.

                        So according to the talking bull heads—–CNBC had three of them on the screen at once about 2pm—–its time to start nibbling on all the bargains. Soon you may even want to just back up the truck.

                        You can supposedly see it right here in the charts. The market hit the October 15 Bullard Rip low last week, and has gone careening upwards where it is now allegedly forming a new bottom around 1950. Remember, its a process. Be patient.


                        ^SPX data by YCharts

                        Not on your life! The world is heading into an unprecedented monetary deflation——with output and trade falling nearly everywhere. That implosion is already rumbling through Canada, Mexico, Brazil, Australia, South Korea, Malaysia, Indonesia, Russia, Japan, the Persian Gulf oil states and countless lesser economies in between. And at the center, of course, is the unraveling of the Great Red Ponzi of China.

                        In the face of this on-coming economic storm, honest financial markets would have been selling off long ago, and, in fact, would never have approached today’s absurd levels of over-valuation. But financial markets have been hopelessly corrupted by two decades of massive central bank intrusion and falsification of asset prices. Consequently, Wall Street punters and their retainers and cheerleaders cannot see the forest for the trees.

                        Thus, one of today’s CNBC permabull threesome reassured viewers that the US economy is chugging along in fine fashion and that China is a big problem——but for the policymakers in Beijing, not the S&P 500.

                        The “1000 points of fright” last Monday is actually a gift. You can now buy the market at 15X, which is tantamount to a steal. So he said, and with no inconsiderable air of annoyance that anyone would think otherwise, let alone succumb to panic.

                        Well, let’s see. The implied “E” in that proposition is $130 per share on the S&P 500 for 2016. But that’s the Wall Street sell-side’s version of earnings ex-items.

                        So let’s start with where we are at the end of Q2 2015 in the real world of GAAP profits. That is, the kind of earnings that CEOs and CFOs certify to the SEC upon penalty of jail as fair, accurate and complete, according to well settled general accounting principles.

                        It turns out that the reported LTM net income (latest 12 months as of June 2015) of the 500 largest US companies in the index came in at $97.32 per share. But that’s down considerably from the LTM figure of $103.12 per share in the June quarter of last year, and was off by 8%from peak LTM earnings of $106 per share in the September quarter last fall.

                        What this means is that the market is not really trading at 15X at all, but closed today at 20X—–which is an altogether different kettle of fish. By the lights of permabulls like CNBCs 2pm trio, of course, the market is always trading at 15X and is always cheap. You might even think that Wall Street’s ex-items year-ahead EPS estimates are goal-seeked—-and you might well be on to something.

                        In any event, how do we leap the chasm from $97 per share and falling to $130 per share and soaring? Well, you mount a Wall Street hockey stick, close your eyes to the rest of the world and hope for a swell ride.

                        In the alternative, you might want to scroll back to nearly an identical inflection point in mid-2007 when the Greenspan housing and credit bubble was nearing its apogee. To be specific, LTM GAAP earnings at the time were about $85 per share and the June 2007 quarter closed with the index at about 1500 or just 4% below its October peak of 1565.

                        So the market was positioned at 17.6X honest-to-goodness GAAP earnings in the eve of the Greenspan Bubble’s collapse. Needless to say, that was a pretty sporty multiple under the circumstances—–the rot in the Bear Stearns mortgage funds had already been exposed and the sub-prime market had gone stone cold in the spring. Yet it was well below today’s 20X.

                        Naturally, Wall Street didn’t see it that way at the time. The ex-items consensus for 2008 was $120 per share of S&P 500 earnings, meaning that it was indeed time to back-up the truck. You could buy the broad market for less than 13X, said the talking heads, or more specifically the very same trio that made its appearance today.

                        Indeed, the chasm between reported GAAP and the forward hockey stick ex-items was $35 per share at that point in time. Ironically, today’s spread between the reported actual and the Wall Street hopium is the exact same $35 per share.

                        Here’s what happened next. By the June 2008 LTM period, GAAP earnings had fallen to $51 per share and by June 2009, after the meltdown, S&P 500 earnings for the previous four quarters were, well, $8 per share!

                        That’s right. The great Greenspan financial bubble collapsed; the global economy buckled; and corporate balance sheets were purged of 7-years worth of failed investments and financial engineering maneuvers gone astray, among sundry other losses. In the end, Wall Street’s $120 per share hockey stick got smashed into smithereens.

                        Eight years later we are at an even more fraught inflection point. The post-crisis money-printing binge was orders of magnitude larger and more radical, and was universally embraced by every significant central bank on the planet. As a consequence, the resulting financial bubble has become far more incendiary than the one which burst in September 2008, and the distortions, deformations and malinvestments in the global economy dramatically more insidious.

                        Obviously the onrushing collapse of China’s purported miracle of red capitalism is the epicenter of this great global deflation, but every nook and cranny of the world economy is implicated; and its shock waves are already wreaking havoc in areas that were especially swollen by the China trade.

                        On a nearby page, for example, we outlined the unfolding disaster in Brazil. This chart on the trend in year-over-year retail trade is stunning because Brazil’s inflation rate is above 5%. So when nominal sales plunge from the boom time rate of 11% to negative 1% in June, it means that real sales are shrinking at nearly a depressionary pace.


                        By all accounts, in fact, Brazil is plunging into its worst recession in the last half century. After years of booming jobs growth fueled by exports and a massive internal dose of monetary and fiscal profligacy, for example, its economy is now shedding workers at an unprecedented pace.


                        The point here is that Brazil is just the leading edge of the epochal worldwide monetary reversal now underway. During the last 15 years its central bank balance sheet literally exploded, rising by more than 10X, while loans to the private sector more than quadrupled in the last seven years alone.


                        The consequence was a frenzy of government and household spending and business investment, expansion and speculation that bloated, deformed and destabilized the Brazilian economy beyond recognition. And those distortions were not contained to the Amazon economic basin alone, but where connected by a two-way highway of financial and trade flows that penetrated right into the heart of the US economy.

                        In the first instance, the massive but artificial and unsustainable export boom to China and its EM satellites generated enormous capital inflows to Brazil which caused its exchange rate to soar, even as its government frantically attempted to contain its rise. During that pre-2012 period, its finance minister even coined the terms “currency wars”.

                        The effect of the China export boom and the massive capital inflow, however, was to create an economy with apparent dollar purchasing power far greater than its sustainable real wealth and output capacity. This immense distortion is best measured by the US dollar value of its GDP. As shown below, during the six years between 2006 and 2012, Brazil’s dollarized GDP grew at a fantastic 20% annual rate!


                        It is no wonder Miami became a boom town. Giddy Brazilians who had enough sense to realize its socialist government had not performed an economic miracle of fishes and loaves exchanged their red hot real’s for dollars and trucked northward to condo land in south Florida.

                        At the same time, its booming economy was a magnet for US money managers parched for yield in Bernanke’s ZIRP repressed market and for US exporters temporarily benefited by a dollar/BRL exchange rate that made them suddenly far more competitive. Accordingly, hundreds of billions of hot dollar capital flowed into Brazilian equity and corporate bond markets, while US exports nearly quadrupled in eight years.


                        US Exports of Goods to Brazil data by YCharts

                        Here’s the point. The US economy was not “decoupled” from Brazil in the slightest during the expansion of the great global monetary boom that has now crested. Nor will it uncouple during the deflationary bust that must necessarily ensue.

                        The ultimate worldwide hit to US exports is evident in the 20% drop in shipments to Brazil shown in the chart above, and that’s just for starters because its economic depression is just getting underway. Likewise, the panicked flight of hot dollars from Brazil now besetting the global financial markets is only indicative of the turmoil to come as the massive “dollar short” unwinds on a global basis.

                        So this is not a retest. We are in the midst of an unprecedented global deflation. A real live bear market is once again at hand.


                        Comment


                        • Re: Flying Down to Brazil

                          don, i think you should provide a link to the source of that post. you usually do, i know, but you must have forgotten this time.

                          Comment


                          • Re: Flying Down to Brazil

                            Originally posted by jk View Post
                            don, i think you should provide a link to the source of that post. you usually do, i know, but you must have forgotten this time.
                            It's David Stockton.

                            Particularly telling for South Florida:

                            That implosion is already rumbling through Canada, Mexico, Brazil ....

                            It is no wonder Miami became a boom town. Giddy Brazilians who had enough sense to realize its socialist government had not performed an economic miracle of fishes and loaves exchanged their red hot real’s for dollars and trucked northward to condo land in south Florida.
                            Canadian Snow Birds have nested in SF in increasingly large numbers, I assume a byproduct of the far-north wealth effect.

                            Comment


                            • Re: Flying Down to Brazil

                              Originally posted by don View Post
                              It's David Stockton.

                              Particularly telling for South Florida:


                              Canadian Snow Birds have nested in SF in increasingly large numbers, I assume a byproduct of the far-north wealth effect.
                              Canadian Snowbirds from the eastern half of the country, and especially from Quebec, have been wintering in Florida for decades. With the exception of the US housing bubble period just prior to the financial crisis, Florida housing has typically been attractively priced compared to Canadian properties, and had the distinct advantage of much nicer winters and the ability to golf in December, compared to Central Canada.

                              The western half of Canada finds it too expensive to fly to/from Florida and instead prefers SoCal (Palm Springs is a favourite) and Phoenix for a winter haven. Lots of home purchases were made after the housing bust with high value Loonies at the time (I can't count the number of Calgarians that bought places in Phoenix at below lot servicing costs at the time). That has now reversed, of course, and with the crashing Northern Peso it has become quite expensive to vacation or even travel south of the border. The Canadian bank credit cards are charging 1.33 as an exchange rate on US$ purchases (try booking a hotel or renting a car without using a credit card!).

                              I am swallowing hard over the exchange rate, but plan to point the spinners south and head to Reno later this month for the National Championship Air Races. That might be my last excursion south of the border for a while, unless the Loonie recovers to some degree (I think it has further to fall).

                              Comment


                              • Re: Flying Down to Brazil

                                Canadian Snowbirds from the eastern half of the country, and especially from Quebec, have been wintering in Florida for decades. With the exception of the US housing bubble period just prior to the financial crisis, Florida housing has typically been attractively priced compared to Canadian properties, and had the distinct advantage of much nicer winters and the ability to golf in December, compared to Central Canada.
                                Do these truisms prevail under the present conditions when buying a second home is the option? I would think not.

                                Comment

                                Working...
                                X