 Tweet
Tweet

The big story of 2012 was the incredible decline in available housing inventory for sale. This trend appears to be continuing and is adding a tremendous amount of pressure on the current market especially for those looking to buy. Ironically, the increase of real estate values will also revive many home owners from their zombie slumber in negative equity. Over 1.4 million borrowers came out of a negative equity position in 2012. This is a large number given the limited amount of inventory on the market.
How many of these people will be looking to sell as their homes turn into positive territory? The quest for inventory might come from a very familiar place with regular people selling their homes for a variety of reasons including moving to another place, cashing in, marriage, divorce, new job, or any other factors that cause people to sell. In other words, a more normal housing market. Will these former negative equity borrowers push inventory levels up?
The underwater nation
Even with 1.4 million borrowers exiting out of negative equity, we still have 10.7 million American underwater. In many cases, some are severely underwater:
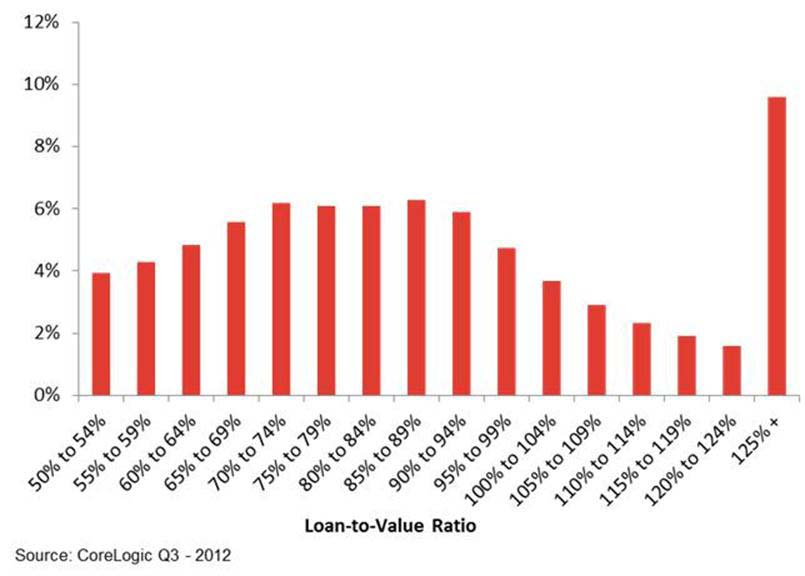
Nearly 10 percent of borrowers are still in deep trouble with loan-to-value ratios above 125 percent. 22 percent of properties with a mortgage are still underwater and this is a sizable amount. The drastic drop in inventory is uncharacteristic but does make sense. Banks are controlling the flow of distressed properties onto the market. We currently have over 5 million homes in some sort of distress (foreclosure or with at least one missed payment). This has been going on since the housing bubble popped. The total completed foreclosure count is somewhere around 5 million.
We also know that most underwater borrowers are paying their mortgages on time:
�(NYTimes) Still, just because a homeowner is underwater does not necessarily mean that foreclosure is imminent. Nine out of 10 are continuing to make their loan payments on time, the report said, with just 10 percent more than 90 days delinquent.�
This is an older article referencing a Zillow report back in May of 2012 and home prices have gone up from that point (in the article they reference 31 percent of borrowers underwater while today according to the latest report, it is down to 22 percent).
People obsessively check real estate values now that it is so easy to check online, even if they are only estimates. After all, some of the systems follow similar methods used to �comp� properties. For example, many appraisals will look at similar recent home sales in a neighborhood to derive a value for a current home. This misses the bigger picture as we saw with the housing bubble but this is how the process is conducted. With that said, how many people from that 1.4 million group will now sell encouraged by increasing values?
The sunshine states still dominate the negative equity data:
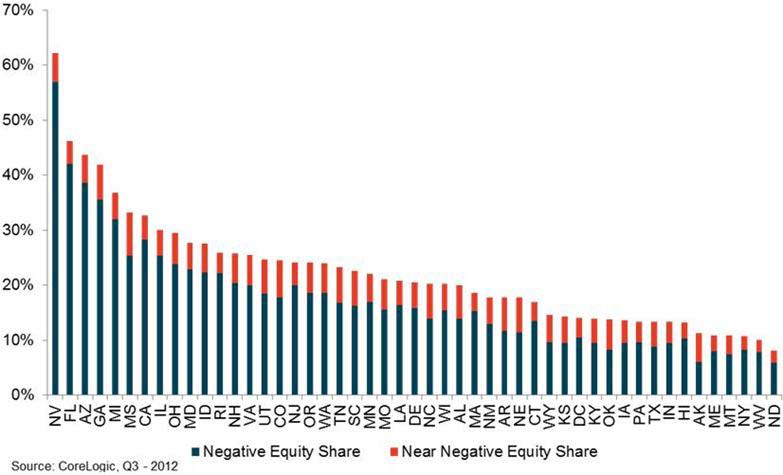
Nevada still has a stunning 60+ percent of borrowers at or near negative equity. Florida and Arizona are in the 40+ percent range while California comes in with 30+ percent. Keep in mind these are figures factoring big price increases which tells you how deep in the well some home owners truly are.
Now taking a look at that first chart, if home prices go up by say another 5 percent, that will bring out another 4 percent of these underwater borrowers. This has the potential of bringing up another 2 million home owners into a neutral position. This additional potential supply is governed from very different forces that we are now seeing with banks and their REO inventory.
On the other side, buyers are now constrained by available mortgages and low interest rates. Investor demand is likely to continue domestically and from abroad.
Inflation changes � 2000 to 2012
Let us look at price changes in Southern California since 2000:
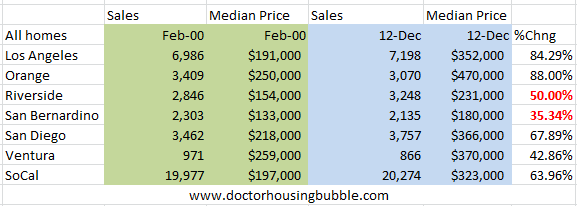
Over this time period, according to official California CPI data, inflation over this period was 37.8 percent. With that said, San Bernardino and Riverside seem priced well within range (even possibly Ventura). LA and OC still seem on the higher end. I dug up per capita data for California and found this:
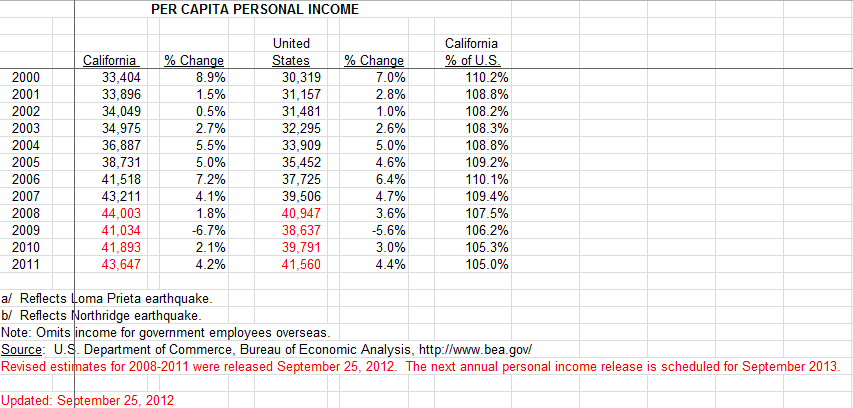
Nominal per capita income went up 30 percent so inflation stripped away any gains from the last 12 years. When you start examining it from this perspective, you realize that leverage via lower interest rates is the big game in town. Also, incomes are simply not keeping pace with inflation and that is why you are seeing more people allocating a larger portion of their income to housing, both in rents and total housing costs.
Since the bulk of underwater mortgages are being paid for, it will be interesting to see what these newly minted �equity� borrowers will do.
http://www.doctorhousingbubble.com/n...alifornia-reo/
Comment