 Tweet
Tweet
For vast areas of the United States home prices are close to inflation adjusted trend lines. With incredibly low interest rates courtesy of the Fed ballooning their balance sheet up to nearly $3 trillion, the government and the Fed are basically the main player in eating up mortgage backed securities. Over 95 percent of mortgage origination come from the government and are issued by the large too big to fail banks. This has now been the case since the housing bubble peaked and burst in 2007.
When we look at prices nationwide you do see prices trending with longer-term inflation trend lines. However, with that said, we realize also that real estate is local and you can see this through manic like behavior in niche markets. One clear example I am seeing is with investors overbidding for investment properties. Another is with flipping in certain markets. By definition flipping is only profitable if you can sell in a time frame where all expenses and lost time are made up by the profit you make on the sale. We�ll discuss some of this later in the article from an investor perspective but let us first look at home prices across the US.
Inflation adjusted home prices
Home prices are trending towards inflation adjusted levels:
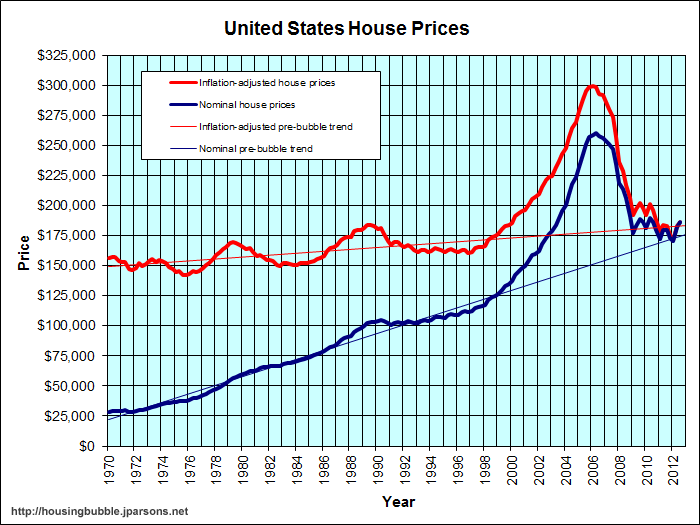
Home prices across this country are down by roughly 30 percent from the nominal peak reached a few years ago. You can see both the nominal and the inflation adjusted trend lines above. We are slightly higher on the nominal front in terms of the trend line going back to the 1970s but not by much. Yet what I would argue, is that home prices in our current environment are driven up not necessarily because the economy is doing so well, but because the Federal Reserve and government backed programs like FHA insured loans combined with low rates are injecting massive liquidity into the market. This was the boom in 2012. But can this continue? That is the big question.
What causes me to pause is when we look at household income. Let us look at this in a similar fashion:
Adjusting for inflation, household income is back to levels last seen in the 1990s. So in real terms, Americans are spending more money on a variety of items adjusting for inflation. In other words, most are losing purchasing power. This can be in the form of college education, healthcare, food, energy, or even housing. This is an important trend to understand because it highlights why the Fed has so aggressively pushed interest rates lower to make up for this lack of real income growth.
Percent of homes in distress
One argument that holds little water is when people look at the entire pool of available housing stock and then state that distressed properties are only a small portion of the entire market. First, at any given point and time only a small pool of homes are available for sale on the market. Even during the peak of the housing bubble this was the case. So any changes with inventory are going to have large impacts. This is why in a previous article we discussed how the drop of inventory in Los Angeles by 60+ percent in one year is shocking.
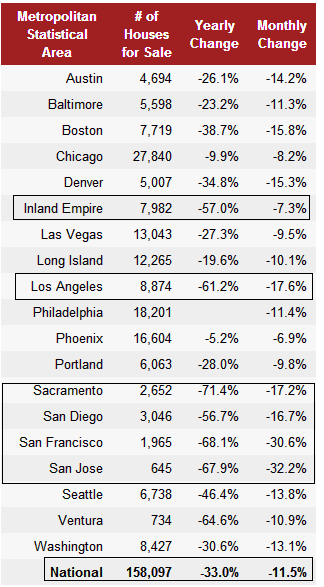
According to the Redfin data, last month there were 8,874 homes for sale in the Los Angeles MSA and this is a county with roughly 10,000,000! According to the latest Census figures 1.4 million homes in Los Angeles County are owner-occupied.
Therefore that 8,874 of available homes represents 0.6 percent of the pool of homes for sale. So it should be rather apparent that at any given point, only a small pool of homes are for sale.
This also brings up distressed property. There are 25,053 homes in Los Angeles County that are either bank owned, scheduled for auction, or have received a notice of default. The amount of distressed property is nearly 3 times the amount of available homes for sale. In thinly traded markets like housing this does make a big difference especially when this inventory is not on the market for sale.
So nationwide and even in many parts of California, adjusting for inflation we are getting closer to trend lines. Yet this is being driven more by the added leverage of the Fed and government backing of mortgages instead of solid income growth. But let us look at a mid-tier selective market in Pasadena as a case and point:
3230 E Sierra Madre Blvd, Pasadena, CA 91107
Bedrooms: 4 beds
Bathrooms: 3.0 baths
Single Family: 2,256 sq ft
This is a very nice starter home for a family. Let us look at the price history:
This home sold in September of 2012 for $475,000. It looks like the house has had some recent work so hard to say these are flippers here but the home is now back on the market in less than five months. The home is now listed for $688,800. Did enough work go into this property to add $213,000 in value over the last five months? Cases like this make me believe we are seeing bubble like behavior with flippers. Why? Justify that $213,000 price increase in such a short duration. As someone that understands and works with investment properties, I would simply like to see how that added value occurred over this short period of time.
Opportunity Cost
Another case is opportunity cost when buying a home. In many mid-tier and prime areas of California for example you would need 20 percent down to reach this. Very few people have twenty percent down and this is why FHA backed loans have been used as stop-gap since the private mortgage market dried up in 2007. Now let us use the above home sale as an example again. At the current price you would need:
List price: $688,800
20% down payment: $137,760
PITI: $3,340 (3.5% 30 year fixed rate)
Now assume that you get a rental for the same price. Okay, after 30 years one person has a paid off house and another has paid rent and has no home. However, that 20 percent down payment of $137,760 could have been invested. Say it was invested at a rate of return of 7 percent in the stock market. This alone after 30 years of compounding will be $1,048,664. Of course the home itself would have adjusted because of inflation as well. However, if you look at Japan with massive quantitative easing, home prices are back to levels last seen 30 years ago. So the equation is not as simple as saying that those currently renting are simply flushing their money down the drain especially in areas where a massive down payment is required to get to rental parity.
To reiterate however, for vast parts of this country home prices are back to historical trend lines but in niche markets, where many readers I presume would like to buy, the decision isn�t so clear cut. The above example and many others provide a glimpse as to what is going on.
Investors over estimating profits
My next point is the over saturation of investors in the market. In California, going back to 2008 investors have purchased anywhere from 25 to 30 percent of all home sales. This aligns with nationwide trends. However in places like Las Vegas and Phoenix roughly half of all home sales have gone to investors. This is not a normal market. So whenever you look at sales charts, you have to factor in this figure to realize a good amount of volume is coming from a group that has very little historical comparison. In no time in US history have we had roughly one third of home purchases being made by investors (outside of the housing market of the last decade or so). It is hard to say what happens when this money flows back to other areas.
Another over exuberant trend I am seeing is with bidding wars and over estimating profits. For example, I have communicated with colleagues that are investors out in the Inland Empire. There are cases of auctions being over bid in a frenzy and blasting through any reasonable ratios in terms of rental income or even for fixing up and then flipping. In fact, you are seeing hedge money slowing down in many areas.
If you talk with long-time professionals you will realize that over time roughly half of your gross rents will go to outside costs beyond the principal and interest. These costs include but are not limited to; taxes, insurance, replacing roofs, carpets, damaged walls, and vacancies. I think people underestimate these costs. A simple rule for most investors is never consider a property if it cannot yield at least 1 percent of its sales price on a monthly basis. That is, a $100,000 home should throw off at least $1,000 a month. Sure, your principal and interest is low but taxes, insurance, vacancies, and repairs remain steady. Also, for investment properties you are looking at 20 to 25 percent down. In the Inland Empire I�m seeing places sell for $200,000 that will rent for $1,200 to $1,400 a month. These are not cash cows.
What I suspect from many readers is that they are looking to buy in thinly traded markets where inventory is incredibly scarce and you have a good amount of interest; foreign money, hedge funds, flippers, FHA insured loan buyers, and your regular conventional buyer with a solid down payment. You can pull up the income figures for these zip codes and see that home prices are 8 to 10 time current household incomes versus the 3.5 for nationwide home prices. That is a big, if not fatal, difference.
http://www.doctorhousingbubble.com/i...on-in-housing/
When we look at prices nationwide you do see prices trending with longer-term inflation trend lines. However, with that said, we realize also that real estate is local and you can see this through manic like behavior in niche markets. One clear example I am seeing is with investors overbidding for investment properties. Another is with flipping in certain markets. By definition flipping is only profitable if you can sell in a time frame where all expenses and lost time are made up by the profit you make on the sale. We�ll discuss some of this later in the article from an investor perspective but let us first look at home prices across the US.
Inflation adjusted home prices
Home prices are trending towards inflation adjusted levels:
Home prices across this country are down by roughly 30 percent from the nominal peak reached a few years ago. You can see both the nominal and the inflation adjusted trend lines above. We are slightly higher on the nominal front in terms of the trend line going back to the 1970s but not by much. Yet what I would argue, is that home prices in our current environment are driven up not necessarily because the economy is doing so well, but because the Federal Reserve and government backed programs like FHA insured loans combined with low rates are injecting massive liquidity into the market. This was the boom in 2012. But can this continue? That is the big question.
What causes me to pause is when we look at household income. Let us look at this in a similar fashion:
Adjusting for inflation, household income is back to levels last seen in the 1990s. So in real terms, Americans are spending more money on a variety of items adjusting for inflation. In other words, most are losing purchasing power. This can be in the form of college education, healthcare, food, energy, or even housing. This is an important trend to understand because it highlights why the Fed has so aggressively pushed interest rates lower to make up for this lack of real income growth.
Percent of homes in distress
One argument that holds little water is when people look at the entire pool of available housing stock and then state that distressed properties are only a small portion of the entire market. First, at any given point and time only a small pool of homes are available for sale on the market. Even during the peak of the housing bubble this was the case. So any changes with inventory are going to have large impacts. This is why in a previous article we discussed how the drop of inventory in Los Angeles by 60+ percent in one year is shocking.
According to the Redfin data, last month there were 8,874 homes for sale in the Los Angeles MSA and this is a county with roughly 10,000,000! According to the latest Census figures 1.4 million homes in Los Angeles County are owner-occupied.
Therefore that 8,874 of available homes represents 0.6 percent of the pool of homes for sale. So it should be rather apparent that at any given point, only a small pool of homes are for sale.
This also brings up distressed property. There are 25,053 homes in Los Angeles County that are either bank owned, scheduled for auction, or have received a notice of default. The amount of distressed property is nearly 3 times the amount of available homes for sale. In thinly traded markets like housing this does make a big difference especially when this inventory is not on the market for sale.
So nationwide and even in many parts of California, adjusting for inflation we are getting closer to trend lines. Yet this is being driven more by the added leverage of the Fed and government backing of mortgages instead of solid income growth. But let us look at a mid-tier selective market in Pasadena as a case and point:
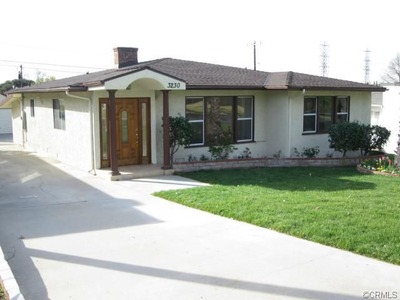
3230 E Sierra Madre Blvd, Pasadena, CA 91107
Bedrooms: 4 beds
Bathrooms: 3.0 baths
Single Family: 2,256 sq ft
This is a very nice starter home for a family. Let us look at the price history:
This home sold in September of 2012 for $475,000. It looks like the house has had some recent work so hard to say these are flippers here but the home is now back on the market in less than five months. The home is now listed for $688,800. Did enough work go into this property to add $213,000 in value over the last five months? Cases like this make me believe we are seeing bubble like behavior with flippers. Why? Justify that $213,000 price increase in such a short duration. As someone that understands and works with investment properties, I would simply like to see how that added value occurred over this short period of time.
Opportunity Cost
Another case is opportunity cost when buying a home. In many mid-tier and prime areas of California for example you would need 20 percent down to reach this. Very few people have twenty percent down and this is why FHA backed loans have been used as stop-gap since the private mortgage market dried up in 2007. Now let us use the above home sale as an example again. At the current price you would need:
List price: $688,800
20% down payment: $137,760
PITI: $3,340 (3.5% 30 year fixed rate)
Now assume that you get a rental for the same price. Okay, after 30 years one person has a paid off house and another has paid rent and has no home. However, that 20 percent down payment of $137,760 could have been invested. Say it was invested at a rate of return of 7 percent in the stock market. This alone after 30 years of compounding will be $1,048,664. Of course the home itself would have adjusted because of inflation as well. However, if you look at Japan with massive quantitative easing, home prices are back to levels last seen 30 years ago. So the equation is not as simple as saying that those currently renting are simply flushing their money down the drain especially in areas where a massive down payment is required to get to rental parity.
To reiterate however, for vast parts of this country home prices are back to historical trend lines but in niche markets, where many readers I presume would like to buy, the decision isn�t so clear cut. The above example and many others provide a glimpse as to what is going on.
Investors over estimating profits
My next point is the over saturation of investors in the market. In California, going back to 2008 investors have purchased anywhere from 25 to 30 percent of all home sales. This aligns with nationwide trends. However in places like Las Vegas and Phoenix roughly half of all home sales have gone to investors. This is not a normal market. So whenever you look at sales charts, you have to factor in this figure to realize a good amount of volume is coming from a group that has very little historical comparison. In no time in US history have we had roughly one third of home purchases being made by investors (outside of the housing market of the last decade or so). It is hard to say what happens when this money flows back to other areas.
Another over exuberant trend I am seeing is with bidding wars and over estimating profits. For example, I have communicated with colleagues that are investors out in the Inland Empire. There are cases of auctions being over bid in a frenzy and blasting through any reasonable ratios in terms of rental income or even for fixing up and then flipping. In fact, you are seeing hedge money slowing down in many areas.
If you talk with long-time professionals you will realize that over time roughly half of your gross rents will go to outside costs beyond the principal and interest. These costs include but are not limited to; taxes, insurance, replacing roofs, carpets, damaged walls, and vacancies. I think people underestimate these costs. A simple rule for most investors is never consider a property if it cannot yield at least 1 percent of its sales price on a monthly basis. That is, a $100,000 home should throw off at least $1,000 a month. Sure, your principal and interest is low but taxes, insurance, vacancies, and repairs remain steady. Also, for investment properties you are looking at 20 to 25 percent down. In the Inland Empire I�m seeing places sell for $200,000 that will rent for $1,200 to $1,400 a month. These are not cash cows.
What I suspect from many readers is that they are looking to buy in thinly traded markets where inventory is incredibly scarce and you have a good amount of interest; foreign money, hedge funds, flippers, FHA insured loan buyers, and your regular conventional buyer with a solid down payment. You can pull up the income figures for these zip codes and see that home prices are 8 to 10 time current household incomes versus the 3.5 for nationwide home prices. That is a big, if not fatal, difference.
http://www.doctorhousingbubble.com/i...on-in-housing/
Comment