Announcement

Collapse
No announcement yet.

It's official: Deal reached on "fiscal cliff"

Collapse
X
 
  • Filter
  • Time
  • Show
Clear All
new posts

  • #31
    Are stocks over priced?

    Originally posted by EJ View Post


    A similar over-reaction to a mid-gap recession in 2013 is possible. The reason is that confidence is still shaky and perception that the U.S. economy may be "down for the count" after years of tepid recovery from the American Financial Crisis.
    Judging by EJ's graph, stocks are overpriced. So a correction would not be "over-reaction" but popping a bubble. Is EJ claiming that equities are a reasonable price now? Is EJ working for Buffet?

    Comment


    • #32
      Re: EJ's graph misleading

      Originally posted by ProdigyofZen View Post
      Actually what EJs chart is showing is what classical economists would have called "fictitious capital." The stock market has risen as a byproduct of this fictitious capital.

      Most bank lending today is to capitalize rent seeking interests on property that already exists and not for hiring labor and production.
      I like the term "fictitious capital", but I have not heard it before. Is it a result of too low real interest rates?
      Hudson emphasizes property tax levels, which could also be a factor. But it seems to me that higher real rates would solve a lot of these problems.

      Comment


      • #33
        Re: EJ's graph misleading

        Originally posted by Polish_Silver View Post
        I like the term "fictitious capital", but I have not heard it before. Is it a result of too low real interest rates?
        Hudson emphasizes property tax levels, which could also be a factor. But it seems to me that higher real rates would solve a lot of these problems.
        I think Hudson would say switching mortgage interest rates (~4% for 30 year) with property tax rates (~1.2% for me) would be a start. Regardless, fictitious capital is the result of low interest rates plus a ton of other collusions between FIRE & gov't - one example is that banks can earn the spread on mortgages while taking very little risk because of Fannie & Freddie guarantees and implicit bailout promise.

        Comment


        • #34
          Re: Are stocks over priced?

          based upon Robert Schiller's work Irrational Exuberance and the PE10 ratio. S&P could drop to 600. It's just a matter of what people are willing to pay for earnings.
          Right now they are willing to pay 22x earnings. Some bad crap comes and the hopium goes away and we are at 600. Just the 50 yr. median shiller PE puts the S&P at 1250. The Panic of 09, SPE hit 13 which is about 900. I would argue it would have settled lower than 13 had not the masive intervention begun. Especially the FASB rule changes.
          Last edited by charliebrown; January 04, 2013, 01:16 PM.

          Comment


          • #35
            Re: Are stocks over priced?

            Originally posted by charliebrown View Post
            based upon Robert Schiller's work Irrational Exuberance and the PE10 ratio. S&P could drop to 600. It's just a matter of what people are willing to pay for earnings.
            Right now they are willing to pay 22x earnings. Some bad crap comes and the hopium goes away and we are at 600. Just the 50 yr. median shiller PE puts the S&P at 1250.

            and what was EJ's ratio of S&P/AU to trigger a sell call?
            are we still monitoring that one and whats the likelyhood of it happening this year?
            (is the $64,000 question du jour)
            esp after the earlier comment about how the market always - ALWAYS - rallies into a recession...

            we're starting to see headlines here n there that seem to indicate some are getting nervous?

            Comment


            • #36
              Re: Are stocks over priced?

              Everything hinges on the bond markets in my opinion. If the 10yr treasury hits 4% things will get interesting. At 4% the roll-over-the-old-debt-into-new-and-get-a-lower-rate party is over.

              Comment


              • #37
                Re: Are stocks over priced?

                All this is interesting, but the real macro numbers show just how incredibly bad the US has devolved;

                We now have 23 million government employees (more than 1 in 5 taxpayers!). One in 107 adults in the US is currently in jail, and 7 million Americans (1 out of 34 adults!) are under 'correctional supervision' (a perfect Orwellian term). Only 14% of those people were charged with an actual crime... as in violence, theft, or something with a victim!

                47 million Americans are taking food stamps!

                No human being could read all of the laws and regulations in the US in a hundred years.

                What a utopian ineptocracy we have created! All this only costs an annual combined government budget of $434,000 for every American that pays a single dollar in federal income taxes.

                Now make sure you physically disarm the 75 million or so Americans who actually pay taxes, aren’t in jail, and don’t work for the government, and the Stalinist Orwellian State will be complete.


                PS: the actual total tax burden on an upper middle class wage earner, when taking all the sales, property, income, service, gas, alcohol, social security, medicare, utilities, vehicle registration and other bs taxes into account was ALREADY over 45% of income before this administration starts sticking its claws in further. For any labor intensive business, the present tax burden increase will likely cut more than 2% into their NET profit margin. I'd wager most businesses in the US don't exceed a 2% profit margin. This tax alone could be the tipping point.

                Comment


                • #38
                  Re: It's official: Deal reached on "fiscal cliff"

                  Originally posted by EJ View Post
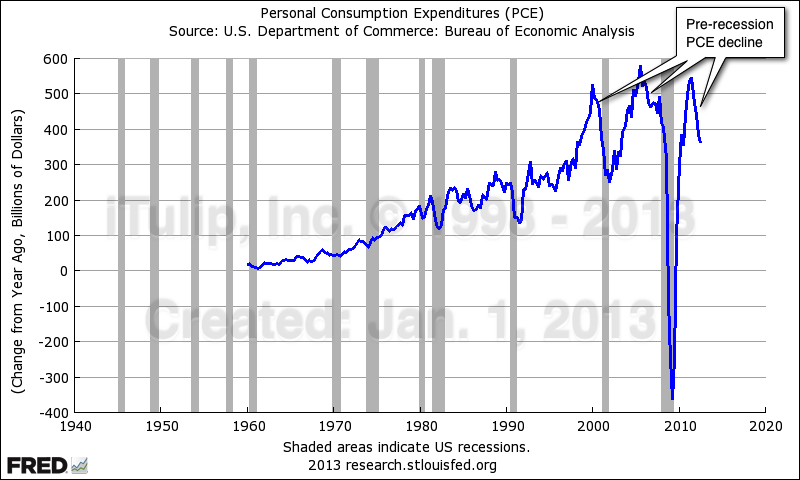
                  ...In fact, personal consumption expenditures (PCE) has been declining the way it does only before a recession.

                  This is an interesting place to start. In this post I'll attempt to aggregate and measure the major components of personal income to maybe help all of us better understand why PCE growth is slowing and where people might be spending their additional money, (assuming they have some). Personal consumption expenditures or PCE is the big component in the government's "Personal Income and Outlay Account". To get a handle on this, it's probably best to look at the major components. We can look at these components as both an absolute value and examine change in growth as EJ has with PCE above.

                  To keep this analysis focused on the period where PCE has recently declined, I'll limit all the charts to the period January 1, 2011 to the latest available FRED reporting period. We'll look first at personal income to ensure growth in income hasn't reversed or slowed down enough to explain PCE slowdown.

                  PersonalIncome1.gif

                  From the above chart it appears that personal income has increased significantly in 2012. Let's look at the rate of change.

                  PersonalIncomeROC.jpg

                  As you can see and may have anticipated from the first chart, the rate of growth was negative in 2011 but has increased in 2012 so that does not appear to be the core issue.
                  Let's take a closer look at PCE. That is, zoom in on EJ's chart to review only the last two years.

                  PCE_Dollars.jpg

                  By reviewing personal consumption in raw change in dollars it's not apparent that anything has changed but let's look at the iTulip view of this same data.

                  PCE_RateOfChange.jpg

                  From this point of view, it's clear that the rate of additional personal consumption is slowing. If you review the $$ total for personal income and personal consumption it appears PCE is 83-84% of available income. We often hear that consumers make up 70% of US GDP but we don't hear that consumers spend 83 of every 100 dollars they have available to them on personal consumption. There aren't any other huge areas where consumers can cut back but let's look at those to understand what portion of income we currently allocate. Let's look at savings next.

                  Savings.jpg

                  The rate of savings fell in 2011 and that makes sense. Personal income was growing very slowly. But savings as a percent of available income did not increase in 2012 even though personal income is on the rise. If consumers are decreasing the rate of personal consumption and didn't increase their savings rate, the money must be going somewhere else. Let's look at interest payments on personal debt.

                  InterestPayments.jpg

                  Interest payments are up in 2011 and nearly flat in 2012. This might explain a small portion of slowdown in PCE but there has to be an additional component. Since it's the largest component next to consumption, let's look at taxes.

                  PersonalTaxes.jpg

                  Tax collections are up about 8.5% over the last couple of years but when we review the increase in personal income, (see my first chart), over the same period it's only about 5.4%...and this is before the 2013 tax increases that will be a minimum of 2% on all taxpayers. Let's look at personal income, personal consumption and taxes on the same chart.

                  PCE_PI_PT.jpg

                  You'll notice that the rate of increase in personal consumption has fallen but the rate of increase in personal income lead the way. With taxes about to head north to a more traditional level we can expect the rate of change for taxes to increase in 2013. But if taxes increase and personal consumption continues to slow, this will be problematic. If the economy slows, personal income will slow down, consumption will fall, taxes will fall....it's not a great picture.

                  The other issue I found while playing with this data is that PCE is currently high as a percentage of PI if we compare it to earlier periods. It appears to be about 5% higher than it has averaged in the past, (that is 83-84% instead of 78-79%). This issue may also put downward pressure on consumption as taxes increase and/or people feel the need for additional savings. I've included a chart below.

                  PCE_PI.jpg
                  Last edited by santafe2; January 07, 2013, 08:12 PM. Reason: Managing images

                  Comment


                  • #39
                    Re: It's official: Deal reached on "fiscal cliff"

                    Originally posted by santafe2 View Post
                    This is an interesting place to start. In this post I'll attempt to aggregate and measure the major components of personal income .....To keep this analysis focused on the period where PCE has recently declined, I'll limit all the charts to the period January 1, 2011 to the latest available FRED reporting period.
                    [ATTACH=CONFIG]4530[/ATTACH]
                    On my computer, your charts don't display.... just a box with an X, and the file name for the chart.
                    If the thunder don't get you then the lightning will.

                    Comment


                    • #40
                      Re: It's official: Deal reached on "fiscal cliff"

                      Originally posted by Ellen Z View Post
                      On my computer, your charts don't display.... just a box with an X, and the file name for the chart.
                      Apparently version wars are on going. Even the mighty jpg now has more than one version and the new version of Photoshop and MS Explorer don't get along. If you upload the Firefox browser it reads the "cymk" version. MS Explorer does not. Here's the note from the good folks at iTulip support:

                      Dear santafe2,
                      Thanks for contacting iTulip forum support.
                      Most likely that these are not really 'jpg' images but just files who's extension ends in .jpg that are saved in CYMA mode.
                      Goggle Chrome has no problem to display these CMYK image files you posted, but they will appear as a red X or broken image in Microsoft Internet Explorer.
                      Try reopening them in an image editor and saving them again in RGB mode or carefully Save As JPEG. In addition, I think this webpage may help fix the issue.
                      Hope this helps.

                      When I have time I'll save them in RGB but I've been reminded that we should support open software and I've switched my browser to Firefox. BTW, my work may not be iTulip/EJ great, but it's worth a 5 minute Firefox upload....

                      Comment


                      • #41
                        Re: It's official: Deal reached on "fiscal cliff"


                        Bill Moyers


                        Last edited by don; January 12, 2013, 08:09 AM.

                        Comment


                        • #42
                          Good "Cliff" article in "WS"

                          http://www.weeklystandard.com/articl...ff_666593.html

                          The standard is a right wing rag, but they have some good articles.

                          This is a good overview of the US financial situation, written by Christopher de Muth, an "office of management and budget" guy. There are some good people in Washington, unfortunately, they are not the ones making the decisions!

                          His basic idea is that "fiscal cliff" is a distraction from the real issue, which is that we have been
                          deficit spending for the last 40 years, if not longer. We have not had to restrain entitlement and defense costs, because we could borrow to fund deficits. "Game over" is happening in the next few years.

                          The 4 page article covers a lot of ground, including:

                          1) Supply side economics became tax cuts for the middle class
                          (originally it meant a good business environment, and lower corporate taxes)

                          2)Keynesian economics became perpetual stimulus spending.
                          (originally it was countercyclical spending during recessions, and saving during booms)

                          3) Federal spending became more oriented towards income security.
                          (formerly it was public goods, major infrastructure, defense).

                          4) Political dynamics of washington DC changed, enabling special interest groups (including citizen groups like AARP) to wield more power and get spending programs going.

                          5) Dollar crisis could be triggered when California asks for federal bailout on the scale of $1trillion (~ 2013).

                          Comment


                          • #43
                            Re: Good "Cliff" article in "WS"

                            Originally posted by Polish_Silver View Post
                            ...
                            There are some good people in Washington, unfortunately, they are not the ones making the decisions!

                            His basic idea is that "fiscal cliff" is a distraction from the real issue, which is that we have been
                            deficit spending for the last 40 years,

                            ...

                            1) Supply side economics became tax cuts for the middle class
                            (originally it meant a good business environment, and lower corporate taxes)

                            2)Keynesian economics became perpetual stimulus spending.
                            (originally it was countercyclical spending during recessions, and saving during booms)

                            3) Federal spending became more oriented towards income security.
                            (formerly it was public goods, major infrastructure, defense).

                            4) Political dynamics of washington DC changed, enabling special interest groups (including citizen groups like AARP) to wield more power and get spending programs going.

                            5) Dollar crisis could be triggered when California asks for federal bailout on the scale of $1trillion (~ 2013).

                            +1
                            would say this is a pretty accurate summary of how 'we got here'

                            methinks the only way we're going to escape is with TERM LIMITS FOR CONGRESS.

                            and i have yet to see ONE credible reason why that isnt step one in fixing the problems THAT THEY HAVE CREATED.

                            the liberal/political apologists typical answer of: 'term limits will result in the lobbyists being the smartest people in the room' is as weak/pure BS as is the whole congressional seniority system totally corrupt.

                            i think the solution to/for a constant turnover in congress - as i believe the founders intended - is a ONE page set of rules that governs lobbyist activities - no idea what those rules ought to be, but i do believe that congress themselves intentionally created a purposefully complicated legal nightmare that prevents We The People from comprehending the 'sausage making process' - and which benefits the legal class in particular - another bastion of liberalism - that inflicts more regulatory pain and costly mandates every year - with 2400pages+ of the 'affordable care act' as Exhibit A

                            and we dont even need to get into the farce/fraud of dodd/frank and the supposed 'reform of the banking system'
                            Last edited by lektrode; January 12, 2013, 02:34 PM.

                            Comment


                            • #44
                              Re: Good "Cliff" article in "WS"

                              methinks the only way we're going to escape is with TERM LIMITS FOR CONGRESS.
                              We all wish it was that easy, Lek. FIRE couldn't find other stooges to take their place?

                              Comment


                              • #45
                                Re: It's official: Deal reached on "fiscal cliff"

                                PCE- % Change YoY.png

                                Can someone enlighten me - If I look at PCE % change YoY (the same data in the one EJ has in $ change) - there is a clear reversal of a megatrend in ~1980. A deceleration is PCE growth rate is happening. Why? I would have expected an acceleration as FIRE economy started fueling debt spending. Puzzling to me.

                                Comment

                                Working...
                                X