 Tweet
Tweet
Social Security: Yahoo Just Explains It Wrong
http://www.cepr.net/index.php/blogs/...lains-it-wrong
Graph inside that debunks any scare stories regarding US demographic changes in one handy visual. I can't retrieve the URL of the picture. Here's a transcript:
Changes in Living Standards 2012-2035 Due to Aging and Productivity Growth:
Aging: about -8%
1% Annual Productivity Growth: about 25%
1.5% Annual Productivity Growth: about 41%
2% Annual Productivity Growth: about 57%
For reference, historical US productivity growth (well over 1.5% a year though most of post-war history):
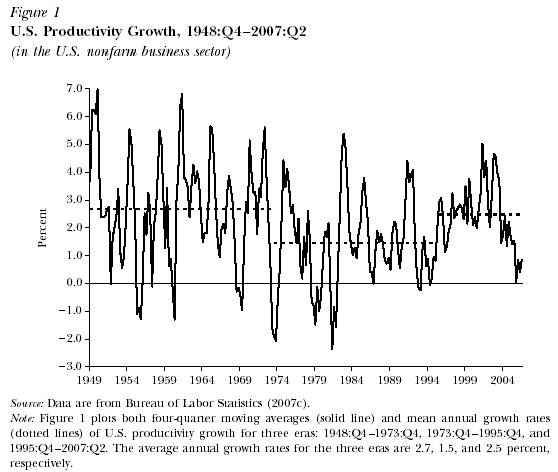
http://theunbrokenwindow.com/2008/05...-productivity/
Also via one of the commenters:
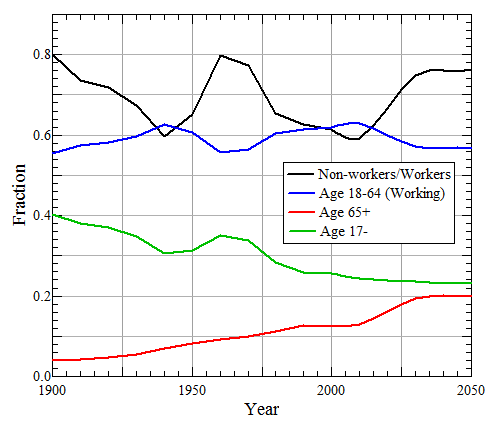
http://www.skeptometrics.org/RealDemographics.html
Ratio between workers and non-workers is more useful as a metric than ratio between workers and retirees.
http://www.cepr.net/index.php/blogs/...lains-it-wrong
Graph inside that debunks any scare stories regarding US demographic changes in one handy visual. I can't retrieve the URL of the picture. Here's a transcript:
Changes in Living Standards 2012-2035 Due to Aging and Productivity Growth:
Aging: about -8%
1% Annual Productivity Growth: about 25%
1.5% Annual Productivity Growth: about 41%
2% Annual Productivity Growth: about 57%
For reference, historical US productivity growth (well over 1.5% a year though most of post-war history):
http://theunbrokenwindow.com/2008/05...-productivity/
Also via one of the commenters:
http://www.skeptometrics.org/RealDemographics.html
Ratio between workers and non-workers is more useful as a metric than ratio between workers and retirees.
Comment