 Tweet
Tweet
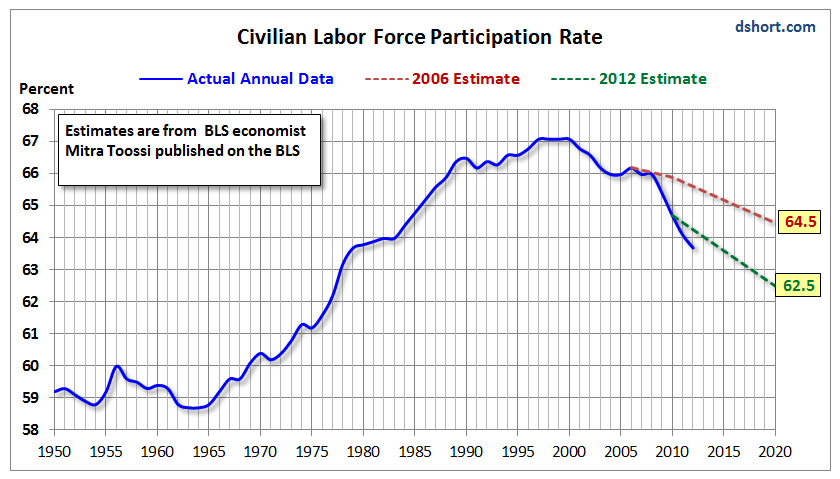
The following graph plots labor force participation rates by BLS economist Mitra Toossi in November 2006 with new projections for the participation rate as of January 2012:
| 1/1/2006 | 66.2 | 66.2 |
| 1/1/2007 | 66.0 | 66.1 |
| 1/1/2008 | 66.0 | 66.1 |
| 1/1/2009 | 65.4 | 66.0 |
| 1/1/2010 | 64.7 | 65.9 |
| 1/1/2011 | 64.1 | 65.8 |
| 1/1/2012 | 63.7 | 65.6 |
76% of Decline In Participation Rate Since 2006 Was Unexpected
The current participation rate is 63.7. In 2006, Toossi estimated the participation rate would be 65.6, a drop of .6 percentage points from 66.2. Instead, the participation rate fell by 2.5 percentage points.
Mathematically, 76% of the decline since 2006 was "unexpected" (1.9 of 2.5).
The current participation rate is 63.7. In 2006, Toossi estimated the participation rate would be 65.6, a drop of .6 percentage points from 66.2. Instead, the participation rate fell by 2.5 percentage points.
Mathematically, 76% of the decline since 2006 was "unexpected" (1.9 of 2.5).
Does this mean that 76% of the labor force decline is the result of cyclical factors and should as such be interpreted as discouraged workers?
How high would U-3 unemployment be if these were counted among the unemployed?
Comment