 Tweet
Tweet
Canadian housing bubble goes into full mania mode � Canadian debt-to-personal income ratio near 145% while US at peak of the housing bubble was at 125%
As global real estate bubbles burst at differing intervals, those still engaged in the depths of mania fever find every convenient argument to justify the existence of the current inflated economic structure. We can debate the nature of the current US housing market but with the median nationwide home price at $151,600 from the most recent Zillow housing report and the median household income at roughly $50,000 prices look to be leveling out especially with the absurdly low interest rates. As we know, housing markets are regional so applying this nationwide trough to frothy markets may not be the best way to measure investment value. However, when we look at the Canadian housing market we realize how insane things have gotten. I�m amazed by how many of the debt rehab or home flipping shows have migrated to the Canadian market. Of course they rarely mention this thinking the American audience will mindlessly assume they are in some other US city to prime the consumption pump. Yet when we look at the metrics, Canada is poised for a deep and profound correction.
The Canadian debt mania
I love how many of those that deny the real estate bubble in Canada point out random facts that were being used during the pinnacle of our own housing bubble. Of course things are different but deep down underneath the hood, the Canadian real estate market is driven by massive speculation and prices that are disconnected from underlying fundamentals (i.e., a bubble). Ultimately people are buying thinking there will be another sucker a few months away. They even parade these people on nationwide television. And for those that claim somehow the balance sheet of Canadians is better I present to you exhibit number one:
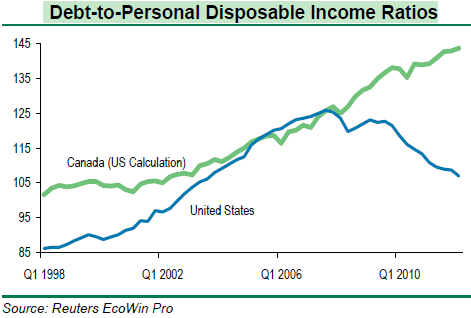
Source: Barclays
I agree with many of those saying things in Canada are very different. Canada is taking this bubble to an entirely new dimension. You can see that in the US, we hit our deleveraging moment of truth in 2007 but Canada has pushed on forward. To argue that households are taking on manageable debt is nonsense. The US at the peak had nearly a 125% debt-to-disposable income ratio while Canada is now inching closer to 145%!
As we discussed in a previous article, some areas in Canada are wedded to foreign buyers and the slowdown in places like China will have an impact. Yet this is one small piece of the pie. I also agree that like in the US, most of the buying however is occurring by domestic households and as the previous chart highlights, many are going into massive debt to support this lifestyle.
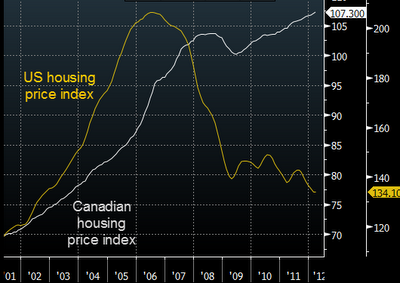
Canada continues to face an epic housing bubble and it will pop. How bad will it be when the bubble pops? Hard to say but look at this chart:
And the market is slowing down:
�(CBC) Price declines in Vancouver dragged the national average home price lower in July, even as most markets saw slight increases compared to the same month a year ago.
The Canadian Real Estate Association said Wednesday the national average price for homes sold in July 2012 was $353,147, down two per cent from the same month a year earlier.�
Is this the top? The longer this mania goes the more painful the unwinding will be. Similar to the US housing bubble that coincided with very good employment figures, Canada is relying very heavily on real estate as a part of their economic growth:
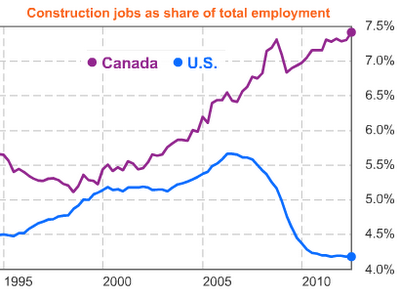
The share of construction jobs in relation to overall employment is nearly twice as high as it is in the US. This massive growth coincided hand and hand with the housing bubble. It becomes a chicken and egg type argument. Is the economy healthy because of real estate or is real estate healthy because of the economy? A similar scenario unfolded in the US. Yes, Canada is not the US but given the household debt figures and the mania in real estate, when the contraction comes you wonder if people will take solace in their neighbors down south who are in year five of the great unwinding. We do have some experience in regards to flushing out trillions of dollars in real estate wealth. From some of the comments many have drank the real estate Kool-Aid and the only thing that will change that is when the punch bowl is taken away.
http://www.doctorhousingbubble.com/c...a-real-estate/
As global real estate bubbles burst at differing intervals, those still engaged in the depths of mania fever find every convenient argument to justify the existence of the current inflated economic structure. We can debate the nature of the current US housing market but with the median nationwide home price at $151,600 from the most recent Zillow housing report and the median household income at roughly $50,000 prices look to be leveling out especially with the absurdly low interest rates. As we know, housing markets are regional so applying this nationwide trough to frothy markets may not be the best way to measure investment value. However, when we look at the Canadian housing market we realize how insane things have gotten. I�m amazed by how many of the debt rehab or home flipping shows have migrated to the Canadian market. Of course they rarely mention this thinking the American audience will mindlessly assume they are in some other US city to prime the consumption pump. Yet when we look at the metrics, Canada is poised for a deep and profound correction.
The Canadian debt mania
I love how many of those that deny the real estate bubble in Canada point out random facts that were being used during the pinnacle of our own housing bubble. Of course things are different but deep down underneath the hood, the Canadian real estate market is driven by massive speculation and prices that are disconnected from underlying fundamentals (i.e., a bubble). Ultimately people are buying thinking there will be another sucker a few months away. They even parade these people on nationwide television. And for those that claim somehow the balance sheet of Canadians is better I present to you exhibit number one:
Source: Barclays
I agree with many of those saying things in Canada are very different. Canada is taking this bubble to an entirely new dimension. You can see that in the US, we hit our deleveraging moment of truth in 2007 but Canada has pushed on forward. To argue that households are taking on manageable debt is nonsense. The US at the peak had nearly a 125% debt-to-disposable income ratio while Canada is now inching closer to 145%!
As we discussed in a previous article, some areas in Canada are wedded to foreign buyers and the slowdown in places like China will have an impact. Yet this is one small piece of the pie. I also agree that like in the US, most of the buying however is occurring by domestic households and as the previous chart highlights, many are going into massive debt to support this lifestyle.
Canada continues to face an epic housing bubble and it will pop. How bad will it be when the bubble pops? Hard to say but look at this chart:
And the market is slowing down:
�(CBC) Price declines in Vancouver dragged the national average home price lower in July, even as most markets saw slight increases compared to the same month a year ago.
The Canadian Real Estate Association said Wednesday the national average price for homes sold in July 2012 was $353,147, down two per cent from the same month a year earlier.�
The share of construction jobs in relation to overall employment is nearly twice as high as it is in the US. This massive growth coincided hand and hand with the housing bubble. It becomes a chicken and egg type argument. Is the economy healthy because of real estate or is real estate healthy because of the economy? A similar scenario unfolded in the US. Yes, Canada is not the US but given the household debt figures and the mania in real estate, when the contraction comes you wonder if people will take solace in their neighbors down south who are in year five of the great unwinding. We do have some experience in regards to flushing out trillions of dollars in real estate wealth. From some of the comments many have drank the real estate Kool-Aid and the only thing that will change that is when the punch bowl is taken away.
http://www.doctorhousingbubble.com/c...a-real-estate/


Comment