Announcement

Collapse
No announcement yet.

My Charts Say Housing May Have Bottomed

Collapse
X
 
  • Filter
  • Time
  • Show
Clear All
new posts

  • My Charts Say Housing May Have Bottomed

    I believe strongly in the Itulip forecasts and "philosophy". However, EJ has predicted that housing (prices from what I remember) will not bottom until 2015-2020. Though many disagree with technical analysis, my reading of the tea leaves of the Philadelphia Housing Index ($HGX) can be interpreted as being extremely bullish for housing in the long-term (see link below for monthly chart of the Philadelphia Housing Index - you may need to "right click" and open in new tab or window).

    Housing Index.jpg

    Some caveats include:
    - I don't know the correlation between this stock index and actual home prices. While unlikely, I'm sure this index could rise at the same time that national home prices continue to fall, in which case EJ and I would both be right.
    - The downtrend line has not been confidently broken yet.
    - As with all technical analysis, the currently bullish pattern can easily morph into a bearish pattern or end up failing completely.

    This is just my two cents, but I've found that, at least with the stock market, ignoring bullish patterns the last 3 years has represented missed opportunities.

    Appreciate any thoughts or feedback.

    Thanks
  • #2
    Re: My Charts Say Housing May Have Bottomed

    Charts like these, the darlings of the NAR, don't reflect fundamentals like ZIRP, the Shadow Inventory, unemployment, underemployment, flat or falling wages and salaries in most fields of employment, mortgage-like student loan debt blocking historically-new potential homeowners, FIRE's fees and interest eating up down payment money, etc.


    Here's a couple of charts that address another aspect of the housing market:

    Modifying the inevitable

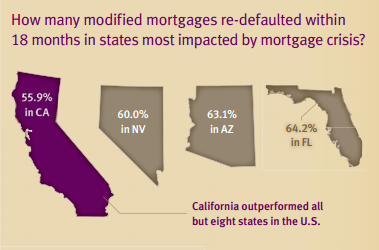
    A recent study conducted by TransUnion found that over half of all modified loans re-defaulted within 18 months:


    Source: TransUnion

    This is not a positive rate. Keep in mind that if you looked at re-defaults say out to 36 months the rate would skyrocket even further. Yet what this does is takes more inventory off the market in conjunction with banks leaking out shadow inventory. In other words, in the dark rooms of banking balance sheets, you have at the latest count 2.8 million Americans that are now 12 months or more behind on their mortgage payments (if we add in those 90 days behind the figures jump even higher). These properties are very likely to end up as foreclosures. Even if stalling efforts are made, many will re-default. This is still an incredibly high figure.

    There was a recent analysis that stated that housing for the next few years will go up and down in spurts. The logic was that as prices rise, those on the sidelines will jump in including putting online more inventory. More inventory will likely drive prices lower with additional distressed properties hitting the market competing with other inventory. Those with the option will pull back and we’ll be left with the current market where banks essentially control inventory. Also, with so many people with a foreclosure on their credit report each year we are removing over 1.5 million potential home buyers from buying for at least a few years.

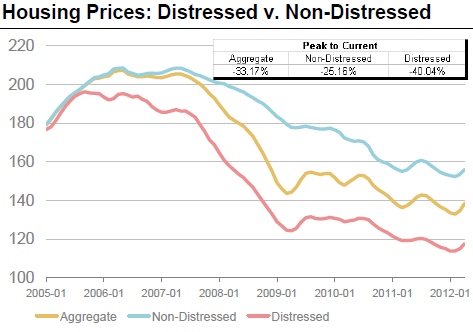
    Distressed properties do sell for much lower prices:


    Source: Morgan Stanley Research. SoberLook

    These are interesting figures. Distressed property is down roughly 40 percent from the peak while non-distressed property is down 25 percent. Yet underlying this data is that many who are not in a distressed position are likely to have pulled back from selling even if they had this in mind. So the sales that do occur are pre-selected to be favorable for these sellers. Even in this segment, prices have fallen. The distressed figures simply highlight what we already know and that banks are slowly realizing prices will not bounce back and have become more aggressive with pricing action including approving more short sales.

    http://www.doctorhousingbubble.com/l...nd-usage-2012/
    Last edited by don; July 01, 2012, 08:40 AM.

    Comment


    • #3
      Re: My Charts Say Housing May Have Bottomed

      existing stock may have bottomed, but it would appear that new construction prices are definitely upticking:
      cost push? and then there's the bernanks definition of 'low inflation' when 'labor has no pricing power'
      looks like that might be changing perty quick:

      http://www.businessweek.com/articles...sis-no-workers

      and then there's this:
      http://www.denverpost.com/wildfires/...and-30-percent
      347 gone, nearly 1000 'affected' and this is just ONE blaze...
      i guess thats one way to take care of 'excess supply' (wondren how thats going to work if the ins cos decide that 'actual cash value' will take precedance over replacement cost and/or if the banks decide the mortgage needs to be satisfied before rebuilding happens and the place was 'underwater' before it burnt - that would be a very cooold irony - but dont know how these things work)

      word from a pal over in GA, lake lanier area, sez the developers are on the move again, confirms this one:
      http://online.wsj.com/article/SB1000...958115800.html

      Comment


      • #4
        Re: My Charts Say Housing May Have Bottomed

        A number of others have also noted that housing may have 'bottomed'.

        However, a bottom isn't the same as a recovery. We could, for example, bump along this bottom for several more years before prices actually start going up (and staying there).

        Some factors to consider:

        1) Wages. They aren't going up overall. Hard to see home prices rising until that happens (see Burry)

        2) Interest rates. They're are zero - so unless the government pushes negative Fed rates, hard to see improvement from that standpoint. On the other hand, interest rates rising due to inflation/Ka Poom are a real possibility.

        3) Inventory. Massive REO/shadow inventory.

        Comment


        • #5
          Re: My Charts Say Housing May Have Bottomed

          Originally posted by gugion View Post

          Appreciate any thoughts or feedback.
          Did you calculate in the collapse of the Eurozone, from which the US derives 1/2 of it's export income?

          Eurozone collapses, Eurozone customers for US goods no longer buying, lots of US business failures, increased unemployment, little money to spend on housing, house prices go down . . . . .
          raja
          Boycott Big Banks • Vote Out Incumbents

          Comment


          • #6
            Re: My Charts Say Housing May Have Bottomed

            Originally posted by raja View Post
            Did you calculate in the collapse of the Eurozone, from which the US derives 1/2 of it's export income?

            Eurozone collapses, Eurozone customers for US goods no longer buying, lots of US business failures, increased unemployment, little money to spend on housing, house prices go down . . . . .
            Chances are great you can soon throw in the ending of the Canadian Wealth Affect (CWA), from their Housing Bubble, which is as bad or worse than the US bubble. No CWA, no Florida condos.

            Comment


            • #7
              Re: My Charts Say Housing May Have Bottomed

              Originally posted by don View Post
              Chances are great you can soon throw in the ending of the Canadian Wealth Affect (CWA), from their Housing Bubble, which is as bad or worse than the US bubble. No CWA, no Florida condos.
              and then maybe anglais might even return as the most overheard along the boardwalk in 'ollywood
              the 'french riviera' of florida ;)

              (no offense to our quebecois friends...)

              Comment


              • #8
                Re: My Charts Say Housing May Have Bottomed

                Originally posted by gugion View Post
                I believe strongly in the Itulip forecasts and "philosophy". However, EJ has predicted that housing (prices from what I remember) will not bottom until 2015-2020. Though many disagree with technical analysis, my reading of the tea leaves of the Philadelphia Housing Index ($HGX) can be interpreted as being extremely bullish for housing in the long-term (see link below for monthly chart of the Philadelphia Housing Index - you may need to "right click" and open in new tab or window).

                [ATTACH=CONFIG]4384[/ATTACH]

                Some caveats include:
                - I don't know the correlation between this stock index and actual home prices. While unlikely, I'm sure this index could rise at the same time that national home prices continue to fall, in which case EJ and I would both be right.
                - The downtrend line has not been confidently broken yet.
                - As with all technical analysis, the currently bullish pattern can easily morph into a bearish pattern or end up failing completely.

                This is just my two cents, but I've found that, at least with the stock market, ignoring bullish patterns the last 3 years has represented missed opportunities.

                Appreciate any thoughts or feedback.

                Thanks
                $HGX represents the fortunes of some of the major homebuilding, mortgage insurance, and building materials firms. Their stock prices are no doubt influenced by prevailing home prices, but like gold mining stocks, but I do not think this stock index tracks any of the major home price indices well enough to use as a proxy.

                Some housing markets have probably hit bottom, though as c1ue notes, that does not necessarily mean an immediate recovery. Other cities, and overall, still have a ways to go IMO, especially after the next recession drives unemployment rates up again.

                Comment


                • #9
                  Re: My Charts Say Housing May Have Bottomed

                  There was a pause in foreclosures.

                  Comment


                  • #10
                    Re: My Charts Say Housing May Have Bottomed

                    The chart below is a representation of the Establishment Survey (B.1)showing workers in the Construction of Buildings Space, aka those who, as the name implies, build buildings. At 1,213,500 workers, this was not only the lowest number of 2012, but the lowest since May 2011, and is just 2100 workers above the last decade lows. Perhaps instead of relying on the NAR's self-promotional brochures and Housing Starts data which capture if and when a shovel has met the earth, one should perhaps track how much actual demand there is for building construction workers and how many jobs this critical component of the economy creates. Sadly, as the chart below shows, not much.


                    http://www.zerohedge.com/news/point-...g-bottom-chart

                    Comment

                    Working...
                    X