Announcement

Collapse
No announcement yet.

gold:wtic

Collapse
X
 
  • Filter
  • Time
  • Show
Clear All
new posts

  • gold:wtic

    http://stockcharts.com/public/1550908/tenpp/4
    sorry chart won't copy. go to link above, about halfway down page. shows gold:wtic since 1992, worth a look

  • #2
    Re: gold:wtic

    Originally posted by jk View Post
    http://stockcharts.com/public/1550908/tenpp/4
    sorry chart won't copy. go to link above, about halfway down page. shows gold:wtic since 1992, worth a look


    looks to be about 3/4 of the way to the "top". What happens then? Does gas shoot up? Gold collapse, or ,more likely, gold and oil continue up at slightly different rates.
    Last edited by globaleconomicollaps; June 23, 2012, 07:05 PM.

    Comment


    • #3
      Re: gold:wtic

      Pity the chart doesn't extend back to 1975 - trying to get guidance from between gold peaks, which is where we are at, is difficult when no past peaks are shown, though one gold nadir is.

      Comment


      • #4
        Re: gold:wtic

        iirc, ej had a post some years ago saying that the real global currency was oil, but he wasn't convinced there was a good way to hold oil, and that gold would do as a substitute. this chart says that's about right.

        Comment


        • #5
          Re: gold:wtic

          Originally posted by jk View Post
          iirc, ej had a post some years ago saying that the real global currency was oil, but he wasn't convinced there was a good way to hold oil, and that gold would do as a substitute. this chart says that's about right.
          The chart compares that value of gold to oil. However, it does not factor in gold's collectibles tax rate of 28%.
          A chart accounting for that would take some of the luster off gold's performance.
          raja
          Boycott Big Banks • Vote Out Incumbents

          Comment


          • #6
            Re: gold:wtic

            Originally posted by raja View Post
            The chart compares that value of gold to oil. However, it does not factor in gold's collectibles tax rate of 28%.
            A chart accounting for that would take some of the luster off gold's performance.
            it's only 28% if your own marginal bracket is at that level or higher. otoh, you'd also have to know the tax bracket of the person holding oil, and in what form the oil was held since futures, partnerships and so on are all treated differently. but otoh [we're now up to 3 hands] if the assets are held in a tax sheltered account, all of these considerations are moot. otoh, [4th hand- bridge anyone?] the capital gains exclusion MIGHT be allowed to disappear, so 28% might look good to some. but otoh, perhaps it won't. so, otoh, perhaps we can leave tax considerations to the individual reader.

            Comment


            • #7
              Re: gold:wtic

              Originally posted by jk View Post
              it's only 28% if your own marginal bracket is at that level or higher. otoh, you'd also have to know the tax bracket of the person holding oil, and in what form the oil was held since futures, partnerships and so on are all treated differently. but otoh [we're now up to 3 hands] if the assets are held in a tax sheltered account, all of these considerations are moot. otoh, [4th hand- bridge anyone?] the capital gains exclusion MIGHT be allowed to disappear, so 28% might look good to some. but otoh, perhaps it won't. so, otoh, perhaps we can leave tax considerations to the individual reader.
              Have to hand it to you jk, hands down one of your handiest posts.

              Comment


              • #8
                Re: gold:wtic

                Originally posted by swgprop View Post
                Have to hand it to you jk, hands down one of your handiest posts.
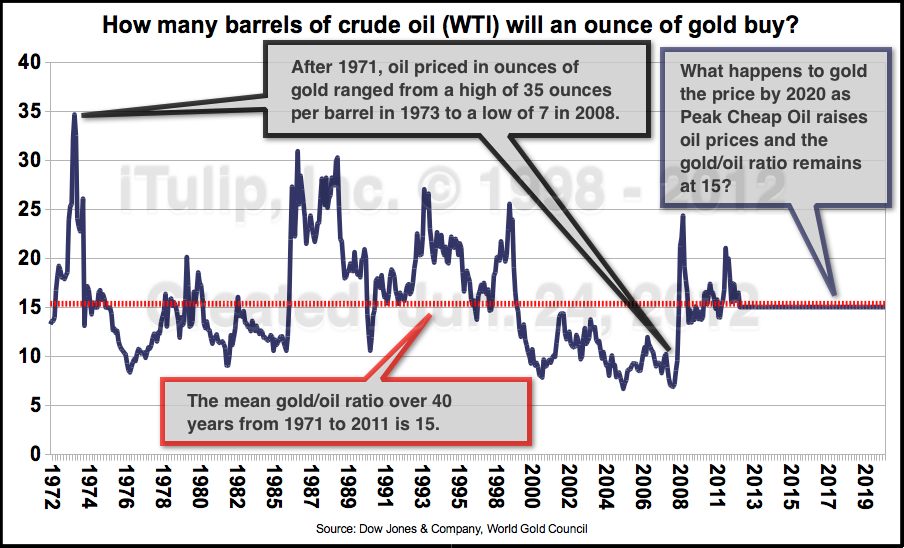
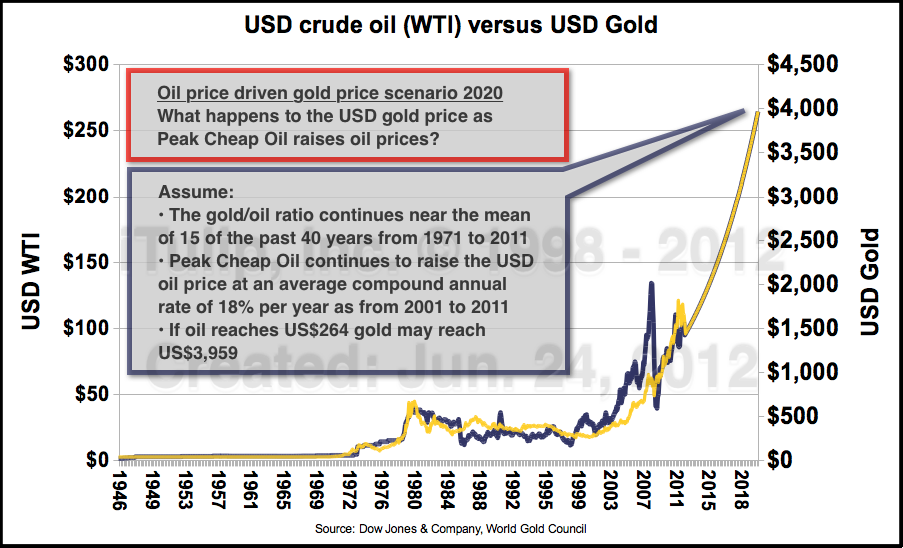
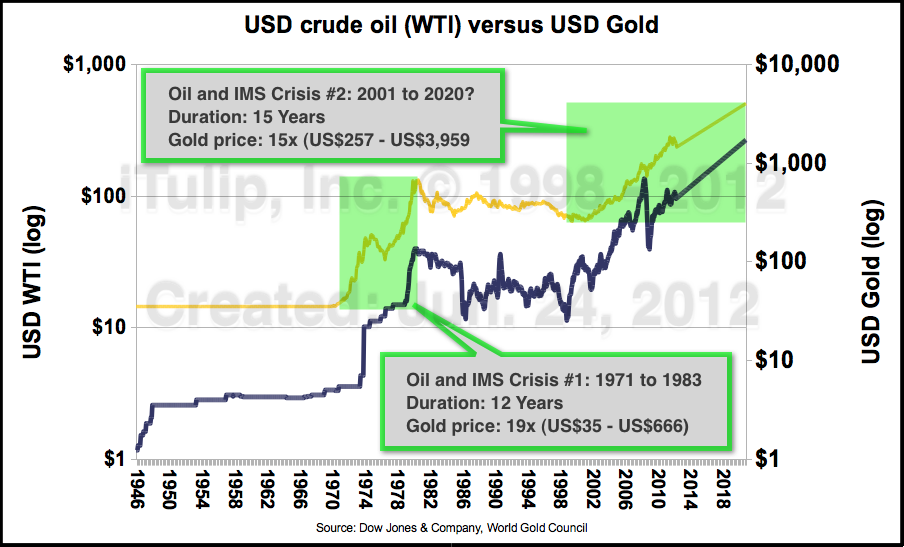
                A half dozen charts from an upcoming Janszen Scenario (Ka-Poom Theory) update on gold, sans explanation.

                Oil and gold prices are average monthly.

                Oil price refers to WTI (West Texas Intermediate crude).

                Assumes the following analysis failed to take into account the drop in oil demand produced by the American Financial Crisis -> Global recession -> Global output gap:


                By 2012, surplus oil production capacity could entirely disappear, and as early as 2015, the shortfall in output could reach nearly 10 million barrels per day,

                - Joint Operating Environment report, Feb. 2010, United States Joint Forces Command


                Instead of 2015, the production shortfall does not reach 10 million barrels per day until 2020.


                Ed.

                Comment


                • #9
                  Re: gold:wtic

                  Originally posted by FRED View Post
                  A half dozen charts from an upcoming Janszen Scenario (Ka-Poom Theory) update on gold, sans explanation.

                  Oil and gold prices are average monthly.

                  Oil price refers to WTI (West Texas Intermediate crude).

                  Assumes the following analysis failed to take into account the drop in oil demand produced by the American Financial Crisis -> Global recession -> Global output gap:


                  By 2012, surplus oil production capacity could entirely disappear, and as early as 2015, the shortfall in output could reach nearly 10 million barrels per day,

                  - Joint Operating Environment report, Feb. 2010, United States Joint Forces Command


                  Instead of 2015, the production shortfall does not reach 10 million barrels per day until 2020.

                  That's a lot lower than your last gold price projection. Is this a rethink?

                  Comment


                  • #10
                    Re: gold:wtic

                    Originally posted by jk View Post
                    it's only 28% if your own marginal bracket is at that level or higher. otoh, you'd also have to know the tax bracket of the person holding oil, and in what form the oil was held since futures, partnerships and so on are all treated differently. but otoh [we're now up to 3 hands] if the assets are held in a tax sheltered account, all of these considerations are moot. otoh, [4th hand- bridge anyone?] the capital gains exclusion MIGHT be allowed to disappear, so 28% might look good to some. but otoh, perhaps it won't. so, otoh, perhaps we can leave tax considerations to the individual reader.
                    jk, you have brought up things that I had not considered. Thank you for broadening my perspective.

                    However, I wonder if much of what you said might not apply to many gold investors?

                    Consider someone who:
                    1) Owns gold coins or other physical, or GLD or other paper gold taxed at collectibles rate.

                    2) Is cashing in an amount large, enough to push him or her into the 28% tax bracket.

                    3) Is not keeping their gold in a tax-sheltered account. (For those with physical, is that even possible . . . or desirable?)

                    4) Is doing their planning based what exists now, i.e., that the capital gains exclusion will exists when they cash out.

                    5) Is comparing gold with oil held in "simple" investment vehicles, and is not considering setting up a partnership or other format to avoid tax.


                    For someone like this, I would say that the 28% collectibles tax is -- hands down -- something to consider in calculating your future gold profits.

                    That being said, judging from your response I can see that I am not as sophisticated as you with investing. Since you have stated in the past that you are an investor in precious metals, perhaps you could briefly share with me and other readers some tips on how you have invested in gold to avoid the 28% collectibles tax. You've already given some hints, but could you flesh it out a bit? Just enough so that we can follow up with our own google search to glean the details and perhaps take advantages of some of the strategies you have already discovered?
                    raja
                    Boycott Big Banks • Vote Out Incumbents

                    Comment


                    • #11
                      Re: gold:wtic

                      there's nothing to flesh out. all my investments are in pensions/ira's, and so taxes are irrelevant to me until i make a withdrawal. then the taxes - as ordinary income- are painful.

                      otoh, you appear to think there is no tax on gains in oil investments.

                      Comment


                      • #12
                        Re: gold:wtic

                        Originally posted by globaleconomicollaps View Post
                        That's a lot lower than your last gold price projection. Is this a rethink?
                        Peace, sir! I am but the humble messenger. We don't have the whole story, either.
                        Ed.

                        Comment


                        • #13
                          Re: gold:wtic

                          Originally posted by FRED View Post


                          I see the mean ratio is 15. But the range is fairly big, between 7 and 25. At the boundaries, this could result in $1980/oz or $7071/oz gold by 2020. Min's and Max's aren't very useful here because they rarely happen, but StdDev would be interesting.

                          I might suggest for your analysis, it would be useful to draw thin or dotted upper and lower 2x StdDev lines projecting out into the future in a cone, where 2xStDev generally represents ~90% confidence. (Or even a Min/Max line if StdDev too difficult to do).

                          Comment


                          • #14
                            Re: gold:wtic

                            Originally posted by tmicou View Post
                            I see the mean ratio is 15. But the range is fairly big, between 7 and 25. At the boundaries, this could result in $1980/oz or $7071/oz gold by 2020. Min's and Max's aren't very useful here because they rarely happen, but StdDev would be interesting.

                            I might suggest for your analysis, it would be useful to draw thin or dotted upper and lower 2x StdDev lines projecting out into the future in a cone, where 2xStDev generally represents ~90% confidence. (Or even a Min/Max line if StdDev too difficult to do).
                            what difference does it make? these are only guesses anyway. why seek an illusion of precision?

                            Comment


                            • #15
                              Re: gold:wtic

                              Originally posted by tmicou View Post
                              I see the mean ratio is 15. But the range is fairly big, between 7 and 25. At the boundaries, this could result in $1980/oz or $7071/oz gold by 2020. Min's and Max's aren't very useful here because they rarely happen, but StdDev would be interesting.

                              I might suggest for your analysis, it would be useful to draw thin or dotted upper and lower 2x StdDev lines projecting out into the future in a cone, where 2xStDev generally represents ~90% confidence. (Or even a Min/Max line if StdDev too difficult to do).
                              Standard deviation is 5.24
                              Ed.

                              Comment

                              Working...
                              X