 Tweet
Tweet
The appetite for more affordable homes in Southern California continues a trend from late 2011 into 2012. One of the more interesting aspects of the current housing market with so many investors buying cheap homes and a large number buying with FHA insured loans is the typical mortgage payment continues to be pushed lower. This week January 2012 data was released for Southern California home sales. The most interesting piece of information in the data was the typical amount people committed to paying for their mortgage last month. $983.
That is right, the typical mortgage payment committed to was $983 last month for over 14,523 sales. We have to dig deeper into the data but this is another indicator that mid-tier and upper-tier cities have many challenges ahead given that current demand is on the lower-end right now.
The ever shrinking monthly mortgage payment
At the peak of the bubble in 2007 the typical mortgage payment committed to (not including insurance, taxes, etc) was $2,447 for SoCal. Today it is down to $983 for recent buyers (this amounts to a 59 percent drop). The monthly drop is probably a better indicator of what families can afford since lenders usually use debt-to-income (DTI) ratios that look at the monthly outlay for buying a home factoring income and other debts. This drop comes at a time when mortgage rates are at historical lows. Take a look at the typical mortgage payment data:
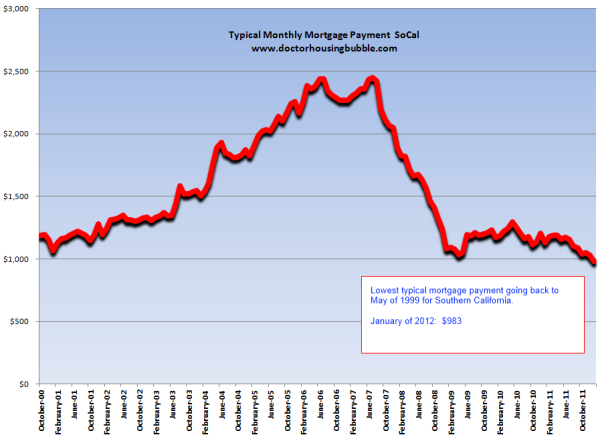
Besides going under $1,000 for the first time in the 2000s we are back to levels last seen in May of 1999. Of course many of you are asking where can I get a mortgage like that in mid-tier to upper-tier cities? Well obviously you cannot but this is a reflection of sales demand at the lower-end but also dropping prices in mid-tier areas. Some key points highlight this:
The overall trend is for lower home prices and this is merely a reflection of lower household incomes. Some people tend to think this is negative news. To the contrary, having home values more in line with household incomes will allow people to spend money on other discretionary items that actually make the economy go round and round. Housing is simply an idle asset class that typically tracks inflation over the long-term. The continuing fall in home prices is a reflection of what households can afford and that is why you now see the typical mortgage payment down to $983. This figure is largely driven by people purchasing homes at lower prices in larger numbers.
Every county last month saw year over year price declines:
Even the more expensive counties of Los Angeles and Orange saw prices move lower. The last time L.A. County was at this level you would need to go back to February of 2003. Orange County went under $400,000 for the first time since the markets were imploding back in Q1 of 2009.
The decline in higher priced areas and seeing these markets make post-bubble lows is really no surprise. What does seem surprising is lower priced markets like the Inland Empire continue to move lower. Riverside County is now down 5 percent from 2011 and San Bernardino fell 1 percent in the same timeframe. Ventura County saw the biggest year-over-year hit going down 7.9 percent.
Now run some hypothetical numbers. Say you bought a home in Ventura in January of 2011 for $350,000 with a 3.5 percent FHA insured loan:
January 2011 home purchase price: $350,000
FHA insured down payment: $12,250
Mortgage balance: $337,750
Today the county has fallen overall by 7.9 percent:
Current home value in January of 2012: $322,350
Not only is the $12,250 down payment washed away, the home owner is now underwater by $15,400. This is nothing to sneeze at here. This one year rush to buy ended up taking out $27,000 and more given that the carrying cost of owning is higher than renting. Keep in mind sellers also pay the commission when selling a home ranging from 4 to 6 percent. Part of the drop in the higher priced counties has to do with more shadow inventory being leaked out. As a mortgage settlement is basically inked in, you can expect more properties coming online in 2012 at lower prices.
21.3 percent of all sales last month were short sales, a record number. What does a short sale require? A short sale requires a bank/lender to agree to a home sale price for less than the total mortgage balance. In other words, even those who own the note realize that housing is not going up in many markets. Foreclosure re-sales were 32.6 percent of the market so in total, 53.9 percent of all sales were from the distressed pipeline.
I am amazed how many people champion ridiculously high home prices with no rise in household income even though insane home prices with toxic mortgages were the reason for this economic crisis in the first place! Some of the most stable economic times in US history saw stable home values, rising household incomes, and moderate mortgage rates. What we had in the last decade was a massive bubble in home values, falling household incomes, and artificially low interest rates. If anything, this slow drop in home values is simply bringing us back to a more stable market. Of course, those in mid-tier to upper-tier markets still want to believe their home values are worth what they were back in 2007.
Those that are buying, are not buying any of that.
http://www.doctorhousingbubble.com/9...les/#more-5349
That is right, the typical mortgage payment committed to was $983 last month for over 14,523 sales. We have to dig deeper into the data but this is another indicator that mid-tier and upper-tier cities have many challenges ahead given that current demand is on the lower-end right now.
The ever shrinking monthly mortgage payment
At the peak of the bubble in 2007 the typical mortgage payment committed to (not including insurance, taxes, etc) was $2,447 for SoCal. Today it is down to $983 for recent buyers (this amounts to a 59 percent drop). The monthly drop is probably a better indicator of what families can afford since lenders usually use debt-to-income (DTI) ratios that look at the monthly outlay for buying a home factoring income and other debts. This drop comes at a time when mortgage rates are at historical lows. Take a look at the typical mortgage payment data:
Besides going under $1,000 for the first time in the 2000s we are back to levels last seen in May of 1999. Of course many of you are asking where can I get a mortgage like that in mid-tier to upper-tier cities? Well obviously you cannot but this is a reflection of sales demand at the lower-end but also dropping prices in mid-tier areas. Some key points highlight this:
-A record 26.8 were absentee buyers in January of 2012
-31.4 percent of all purchases were all cash buyers paying a median $199,000
-FHA insured buyers were 31.2 percent of all sales
-31.4 percent of all purchases were all cash buyers paying a median $199,000
-FHA insured buyers were 31.2 percent of all sales
The overall trend is for lower home prices and this is merely a reflection of lower household incomes. Some people tend to think this is negative news. To the contrary, having home values more in line with household incomes will allow people to spend money on other discretionary items that actually make the economy go round and round. Housing is simply an idle asset class that typically tracks inflation over the long-term. The continuing fall in home prices is a reflection of what households can afford and that is why you now see the typical mortgage payment down to $983. This figure is largely driven by people purchasing homes at lower prices in larger numbers.
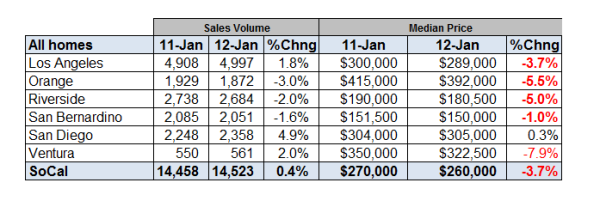
Every county last month saw year over year price declines:
Even the more expensive counties of Los Angeles and Orange saw prices move lower. The last time L.A. County was at this level you would need to go back to February of 2003. Orange County went under $400,000 for the first time since the markets were imploding back in Q1 of 2009.
The decline in higher priced areas and seeing these markets make post-bubble lows is really no surprise. What does seem surprising is lower priced markets like the Inland Empire continue to move lower. Riverside County is now down 5 percent from 2011 and San Bernardino fell 1 percent in the same timeframe. Ventura County saw the biggest year-over-year hit going down 7.9 percent.
Now run some hypothetical numbers. Say you bought a home in Ventura in January of 2011 for $350,000 with a 3.5 percent FHA insured loan:
January 2011 home purchase price: $350,000
FHA insured down payment: $12,250
Mortgage balance: $337,750
Today the county has fallen overall by 7.9 percent:
Current home value in January of 2012: $322,350
Not only is the $12,250 down payment washed away, the home owner is now underwater by $15,400. This is nothing to sneeze at here. This one year rush to buy ended up taking out $27,000 and more given that the carrying cost of owning is higher than renting. Keep in mind sellers also pay the commission when selling a home ranging from 4 to 6 percent. Part of the drop in the higher priced counties has to do with more shadow inventory being leaked out. As a mortgage settlement is basically inked in, you can expect more properties coming online in 2012 at lower prices.
21.3 percent of all sales last month were short sales, a record number. What does a short sale require? A short sale requires a bank/lender to agree to a home sale price for less than the total mortgage balance. In other words, even those who own the note realize that housing is not going up in many markets. Foreclosure re-sales were 32.6 percent of the market so in total, 53.9 percent of all sales were from the distressed pipeline.
I am amazed how many people champion ridiculously high home prices with no rise in household income even though insane home prices with toxic mortgages were the reason for this economic crisis in the first place! Some of the most stable economic times in US history saw stable home values, rising household incomes, and moderate mortgage rates. What we had in the last decade was a massive bubble in home values, falling household incomes, and artificially low interest rates. If anything, this slow drop in home values is simply bringing us back to a more stable market. Of course, those in mid-tier to upper-tier markets still want to believe their home values are worth what they were back in 2007.
Those that are buying, are not buying any of that.
http://www.doctorhousingbubble.com/9...les/#more-5349