 Tweet
Tweet
People tend to forget that $100,000 is a lot of money but when it comes to California housing many just sweep it aside as chump change like finding a quarter in your sofa. You realize how much it is when the nationwide median home price is $150,000 and a $100,000 can go a long way when homes are priced at that level. In Las Vegas you can pick up one home or two condos for that price. Yet we have reached a critical juncture in home prices for California. For over a decade exotic mortgages stretched the stagnant wages of households and allowed many to feed into the bubble with borrowed time and money. Once this was removed and incomes were actually being verified, the Fed had to make up for the phony debt based decade and forced mortgage rates lower and the government throttled up the FHA insured 3.5 percent down mortgages to juice the market. However with rates at all-time lows and down payments at pathetically low levels, the legal leverage has reached a pinnacle and yet home prices continue to fall. Why? Because household wages have gone nowhere for over a decade and potential new home buyers have different goals in mind when it comes to owning a home. We�ve crunched the numbers below and you will be surprised to see that $100,000 does mean a lot in the overall scope of a household.
Measuring real changes and value
I wanted to run a hypothetical between buying a �nice� starter home in 2001 versus buying that same home today but at current inflated bubble prices. Below are the numbers:
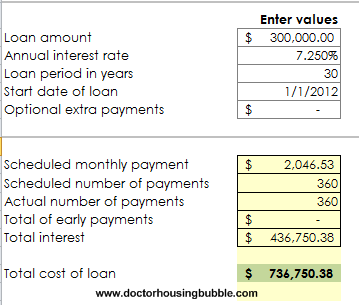
The first case shows someone buying a home with a $300,000 mortgage back in 2001 with a 7.25 percent interest rate. This rate is below the 40 year historical average but is closer to long-term averages. The total cost of the principal and interest over 30 years comes out to be $736,750. Let us now assume this same home is in a bubble market like Burbank or Culver City and now sells for $500,000 today:
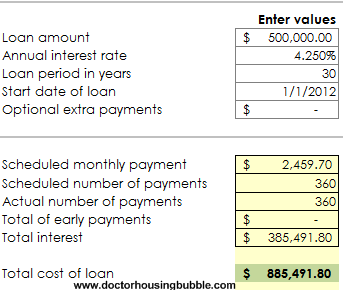
The total cost of this mortgage is now up to $885,491. This is a very real scenario in many bubble cities in California. In the end, this family will end up paying $148,741 more than the family back in 2001 even though mortgage rates have fallen to rock bottom levels. That amount by the way, is the entire cost of a US median home price. Let us not complicate things by throwing in taxes, insurance, and general maintenance costs of owning a home.
You might be asking, but let us see the zip code data for some of these hypothetical cities. Sure, we�ll look at data from 2001 and current 2012 data for three locations: Irvine, Burbank, and Culver City:
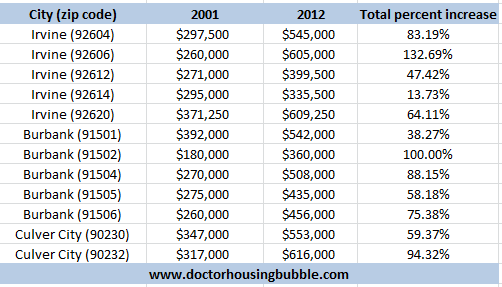
Keep in mind that it is very likely that the housing bubble was already a few years in starting in 2001 but this is as far as my data goes for zip code specific markets. You�ll notice that each of these zip codes has seen incredible amounts of growth. But growth should be measured by the overall inflation rate being factored in:
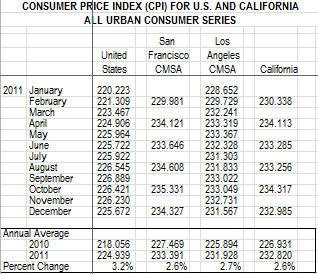
Over this decade long period the California inflation rate was 28 percent. In recent months it has moved gently lower.
Take a look at the chart again. Do you see 28 percent gains for those zip codes? The only area is the 92614 zip code in Irvine. Every other area is still massively above the statewide inflation rate and as we know, over the very long-term housing tracks the general inflation rate.
So you might say, surely incomes in California have surged over this time. Think again:
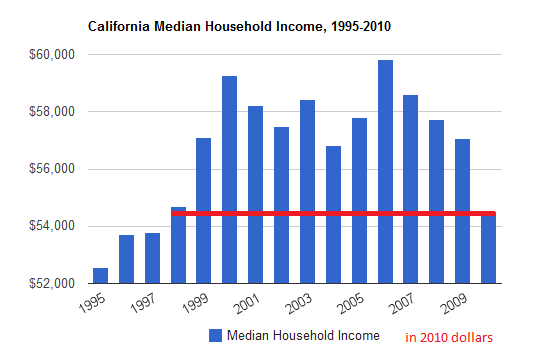
California household incomes are back to levels last seen in the late 1990s. Once I control for all these other factors you realize that housing in many mid-tier cities is still massively inflated. Multiply 28 percent to the 2001 median price and figure out how overpriced each market above is. This is why we showed many zip codes in 2011 falling significantly even though the government, banks, and Fed are trying to juice the market.
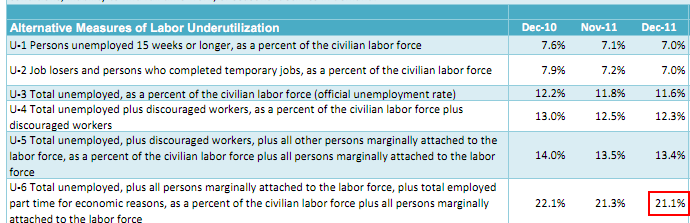
California�s underemployment rate by the way is above 20 percent which will only add additional pressure to household incomes:
The little lull we are feeling is because of Fed, banking, and government policy trying to keep the housing market together. Now the likely impact is that it will have a big say in markets where home prices are $150,000 which is most of the country. But here in mid-tier California cities with loads of shadow inventory we�ll continue to have a slow and steady correction to the downside. Some say they don�t care if they see their home values drop 10 to 20 percent but for a $500,000 place you are basically lighting on fire $100,000. Most would have an issue with that especially when there is little data showing household incomes in California are rising.
And just run a thought experiment. Assume home prices go up 3 percent per year in one of these markets and household incomes remain stagnant (they have for a decade and we are looking more like the Japanese model here). So that $500,000 home today is going to cost this much in 10 years:
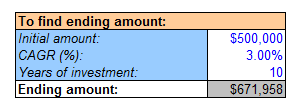
That $500,000 home will then be worth $671,958 in 10 years (a $14,000+ annual price increase). Do you think incomes will keep pace for this? Of course not! This is why it is complete nonsense for those that understand the math and we need only look at the shadow inventory to realize many are now unable to afford their mortgage payments.
Here in California you still have many in the delusional property ladder mindset. They think that they will ladder up to their dream home at some point. This is bogus. Who will many of these pre-bubble buyers sell to? The young are less affluent and guess what, many aren�t as motivated to buy:
�(The Atlantic) Consider the declining appeal of homeownership. The idea that a couple should participate in an ownership society by buying a home has dissolved. Just 12% of whites between 18 and 34 told Pew that owning a home was �one of the most important things� in their life. In a nation where homeownership rates peaked at 67% just seven years ago, that�s a remarkable shift in expectations. And what is the declining appeal of a massive mortgage if not the natural result of an economy that has stiff-armed millions of young students, stuck them with thousands in debt, and forced up to one-third of them into living with their parents when they expected to be cultivating a career?�
Even more startling in the data above, one in three between the ages of 25 to 29 is moving back home. These are your typical first time home buyers. Hard to sell your inflated home when your potential pool has moved back home with incredible amounts of student debt.
The fact that home prices continue to fall in these markets in California is no surprise. Expect more of the same in 2012.
Unless we see household incomes rise, which is a big stretch with a 20+ percent underemployment rate, good luck trying to see those inflated homes go even higher. The bottom line is the market intervention is running out of steam and you really can�t get rates any lower. The Fed is basically the only game in town buying up these mortgages. And what use is a low rate when households are simply poorer? Ultimately home prices need to reflect local household incomes and a $150,000 home price nationwide with a $50,000 household might make sense. But a $500,000 home would require a minimum of a $160,000 household income and the data is not showing that. In other words expect mid-tier and upper-tier markets to face additional price declines.
http://www.doctorhousingbubble.com/l...s-prices-2012/
Measuring real changes and value
I wanted to run a hypothetical between buying a �nice� starter home in 2001 versus buying that same home today but at current inflated bubble prices. Below are the numbers:
The first case shows someone buying a home with a $300,000 mortgage back in 2001 with a 7.25 percent interest rate. This rate is below the 40 year historical average but is closer to long-term averages. The total cost of the principal and interest over 30 years comes out to be $736,750. Let us now assume this same home is in a bubble market like Burbank or Culver City and now sells for $500,000 today:
The total cost of this mortgage is now up to $885,491. This is a very real scenario in many bubble cities in California. In the end, this family will end up paying $148,741 more than the family back in 2001 even though mortgage rates have fallen to rock bottom levels. That amount by the way, is the entire cost of a US median home price. Let us not complicate things by throwing in taxes, insurance, and general maintenance costs of owning a home.
You might be asking, but let us see the zip code data for some of these hypothetical cities. Sure, we�ll look at data from 2001 and current 2012 data for three locations: Irvine, Burbank, and Culver City:
Keep in mind that it is very likely that the housing bubble was already a few years in starting in 2001 but this is as far as my data goes for zip code specific markets. You�ll notice that each of these zip codes has seen incredible amounts of growth. But growth should be measured by the overall inflation rate being factored in:
Over this decade long period the California inflation rate was 28 percent. In recent months it has moved gently lower.
Take a look at the chart again. Do you see 28 percent gains for those zip codes? The only area is the 92614 zip code in Irvine. Every other area is still massively above the statewide inflation rate and as we know, over the very long-term housing tracks the general inflation rate.
So you might say, surely incomes in California have surged over this time. Think again:
California household incomes are back to levels last seen in the late 1990s. Once I control for all these other factors you realize that housing in many mid-tier cities is still massively inflated. Multiply 28 percent to the 2001 median price and figure out how overpriced each market above is. This is why we showed many zip codes in 2011 falling significantly even though the government, banks, and Fed are trying to juice the market.
California�s underemployment rate by the way is above 20 percent which will only add additional pressure to household incomes:
The little lull we are feeling is because of Fed, banking, and government policy trying to keep the housing market together. Now the likely impact is that it will have a big say in markets where home prices are $150,000 which is most of the country. But here in mid-tier California cities with loads of shadow inventory we�ll continue to have a slow and steady correction to the downside. Some say they don�t care if they see their home values drop 10 to 20 percent but for a $500,000 place you are basically lighting on fire $100,000. Most would have an issue with that especially when there is little data showing household incomes in California are rising.
And just run a thought experiment. Assume home prices go up 3 percent per year in one of these markets and household incomes remain stagnant (they have for a decade and we are looking more like the Japanese model here). So that $500,000 home today is going to cost this much in 10 years:
That $500,000 home will then be worth $671,958 in 10 years (a $14,000+ annual price increase). Do you think incomes will keep pace for this? Of course not! This is why it is complete nonsense for those that understand the math and we need only look at the shadow inventory to realize many are now unable to afford their mortgage payments.
Here in California you still have many in the delusional property ladder mindset. They think that they will ladder up to their dream home at some point. This is bogus. Who will many of these pre-bubble buyers sell to? The young are less affluent and guess what, many aren�t as motivated to buy:
�(The Atlantic) Consider the declining appeal of homeownership. The idea that a couple should participate in an ownership society by buying a home has dissolved. Just 12% of whites between 18 and 34 told Pew that owning a home was �one of the most important things� in their life. In a nation where homeownership rates peaked at 67% just seven years ago, that�s a remarkable shift in expectations. And what is the declining appeal of a massive mortgage if not the natural result of an economy that has stiff-armed millions of young students, stuck them with thousands in debt, and forced up to one-third of them into living with their parents when they expected to be cultivating a career?�
Even more startling in the data above, one in three between the ages of 25 to 29 is moving back home. These are your typical first time home buyers. Hard to sell your inflated home when your potential pool has moved back home with incredible amounts of student debt.
The fact that home prices continue to fall in these markets in California is no surprise. Expect more of the same in 2012.
Unless we see household incomes rise, which is a big stretch with a 20+ percent underemployment rate, good luck trying to see those inflated homes go even higher. The bottom line is the market intervention is running out of steam and you really can�t get rates any lower. The Fed is basically the only game in town buying up these mortgages. And what use is a low rate when households are simply poorer? Ultimately home prices need to reflect local household incomes and a $150,000 home price nationwide with a $50,000 household might make sense. But a $500,000 home would require a minimum of a $160,000 household income and the data is not showing that. In other words expect mid-tier and upper-tier markets to face additional price declines.
http://www.doctorhousingbubble.com/l...s-prices-2012/
Comment