 Tweet
Tweet
Young Americans have a challenging road ahead especially when it comes to buying in large metro areas. Since the Great Depression jarred the psyche of our economic fundamentals, each subsequent decade brought on a belief, a vision that the next decade would have it better. For most this meant a better road to economic prosperity and stability. There is a nostalgic reason that the �American Dream� many times includes a picket-white fence. After the end of World War II this is largely what occurred in the U.S. housing growth and the suburban dream expanded in what seemed to be an unlimited growth pattern to satisfy the collective unconscious desires. Yet this structural change came hand in hand with the baby boomer generation and households increasing their true earning potential. Yet younger Americans are facing a dramatically different landscape. They are confronted with tighter job prospects, a shaky stock market, and the growing expenses of college that saddle many with loans that at times appear to reach the levels of a mortgage. Make no mistake that this issue ripples across all age groups. The system for many years was built on trade-up buying. Yet many boomers are downsizing as they enter retirement and many young Americans are unable to pay top dollar for those homes. So what can we say about the future of the young American homebuyer?
Homeownership rates largely skewed by baby boomers and older Americans
It would be helpful to first get a glimpse of homeownership across various age groups:
Source: Census
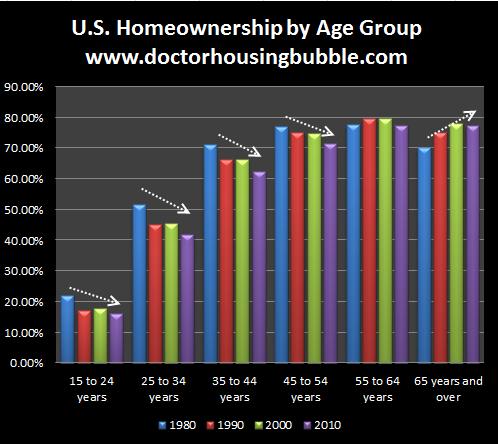
The overall homeownership rate is largely skewed by older Americans, those 55 and older. For every other category, the homeownership rate since 1980 has fallen and in some cases dramatically. Take for example the 15 to 24 and 25 to 34 age ranges:
-1. Younger Americans are simply less affluent. This is backed by net worth data and also salary information.
-2. The decline in good paying manufacturing work. Some have to put off buying a home in place of going to college. It was easier to buy a home with a $25+ an hour job building automobiles with a secure pension and no need for a college degree. The American auto makers now have a new-tier for incoming workers for example were workers make $12 an hour and have stripped down benefits. This is just one of the many cases of where a younger buyer 40 or 50 years ago was able to buy a home and that option is much more challenging today.
-3. Movement to large metro areas. Many of the higher paying jobs now exist in highly populated areas. With the job market being volatile, you may have many younger couples opting to lease places as they move to other locations for career opportunities (i.e., Form Los Angeles to New York, etc).
-4. Delaying marriage and starting a family. This trend has been going on for a few decades now but the push to buy a home usually is done for emotional reasons. With younger Americans delaying marriage and starting a family, the emotional need to buy is pushed further out.
It is too early to tell if these trends will carry through this decade into 2020 but there is little reason to believe it will change. The baby boomer retirement tsunami is going to happen no matter what. This by default will flood the market with housing inventory. The timing is bad since we have a giant pool of shadow inventory that still needs to clear out.
A glimpse of the U.S. housing market
Let us now take a snapshot at the current U.S. housing market:
Source: Census
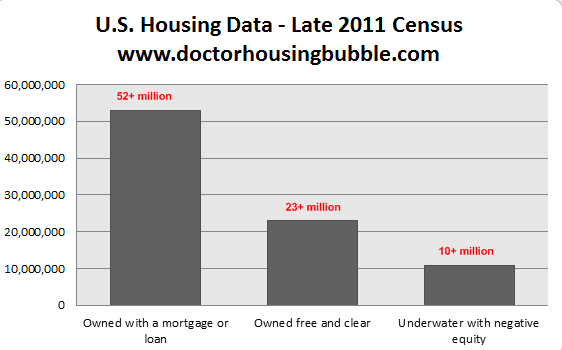
Over 52 million Americans �own� their home but carry a mortgage on the property. Another 23 million own their property free and clear. The majority are older Americans. Also, you have a large number of Americans in a negative equity position. Of the 52 million that own their home over 10 million are in a negative equity position. This trend has inserted a crushing blow to the overall home equity Americans have:
Source: Calculated Risk
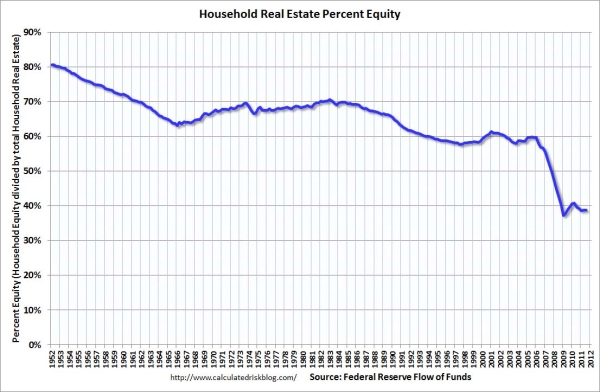
The above chart was always a case study of why we were in a bubble even during the major price appreciation in real estate. Even during the housing bubble household home equity steadily declined as people leveraged to the max and also tapped money out of their housing ATM. Today this number is dramatically lower than the above chart shows because this also includes those who own their homes free and clear. If we simply looked at those with mortgages, we will find that many Americans have very little equity in their homes (forget about the fact that over 10 million would have to pay money to sell their homes).
This is why since the bubble burst in housing a large aspect for home buying has been with investors. The move up segment of buyers has been stunted because of the above reasons we mentioned for younger Americans. The shadow inventory remains elevated as foreclosure timelines are absolutely incredible:
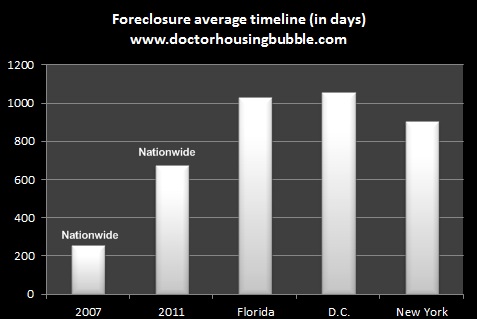
The average foreclosure timeline for a home in Florida is over 1,000+ days! Nationwide we went from an average time of 253 days in 2007 to the current 674 days in 2011. Contrary to what is pushed in the media the housing market is in an utter mess. Banks have absolutely no idea how to deal with this mess so the path they have taken is that of least resistance and largest bailouts.
Another push for young buyers has been with low down payment FHA mortgages. As expected and as we have stated before, having a little down payment makes home buying like a call option. If a home goes up in value, then you win. If it goes down, as it has for many years now, then you simply walk away from the small premium. So let us now take a look at default rates for FHA loans:
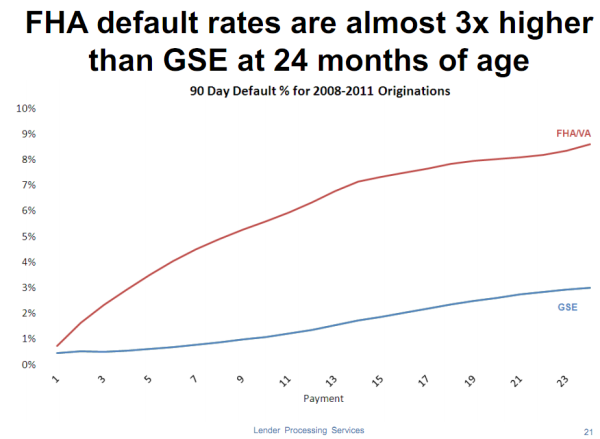
Source: LPS
Not surprising but younger Americans who want to buy a home and do not have the savings to do so will usually opt for these loans that require only 3.5 percent down. Any little economic hiccup can throw things into a spiral and the last decade has turned the U.S. economy upside down like no other time except the Great Depression.
The future of the American housing market does depend largely on how well financially younger American families will do. Just because a retiring American selling his or her home would like a peak price for their property they are likely to find a market that is hungry for cheaper properties. The game has changed and those thinking that a miracle in housing is around the corner fail to understand the built in demographics of the system. It is also beneficial on a long-term basis to have affordable housing so a larger portion of discretionary income goes to creating jobs and moving the economy instead of having large portions of our society trading homes with one another and pretending that is economic growth.
http://www.doctorhousingbubble.com/f...e-projections/
Homeownership rates largely skewed by baby boomers and older Americans
It would be helpful to first get a glimpse of homeownership across various age groups:
Source: Census
The overall homeownership rate is largely skewed by older Americans, those 55 and older. For every other category, the homeownership rate since 1980 has fallen and in some cases dramatically. Take for example the 15 to 24 and 25 to 34 age ranges:
1980 homeownership rate
15 to 24: 22.1%
25 to 34: 51.6%
65 years and older: 70.1%
2010 homeownership rate
15 to 24: 16.1%
25 to 34: 42%
65 years and older: 77.5%
I find trends like this fascinating because it gives us some deeper insight into the demographic challenges facing the future housing market. The big increase in homeownership at the upper-end is largely due to baby boomers moving through like a pig in a python. Yet the sizeable drop for younger Americans is also significant. Demographics can only speak to the major increases at the upper-end of the age scale since the above data is merely looking at homeownership rates broken down into cohorts. There are a few reasons that are likely to account for these shifts:15 to 24: 22.1%
25 to 34: 51.6%
65 years and older: 70.1%
2010 homeownership rate
15 to 24: 16.1%
25 to 34: 42%
65 years and older: 77.5%
-1. Younger Americans are simply less affluent. This is backed by net worth data and also salary information.
-2. The decline in good paying manufacturing work. Some have to put off buying a home in place of going to college. It was easier to buy a home with a $25+ an hour job building automobiles with a secure pension and no need for a college degree. The American auto makers now have a new-tier for incoming workers for example were workers make $12 an hour and have stripped down benefits. This is just one of the many cases of where a younger buyer 40 or 50 years ago was able to buy a home and that option is much more challenging today.
-3. Movement to large metro areas. Many of the higher paying jobs now exist in highly populated areas. With the job market being volatile, you may have many younger couples opting to lease places as they move to other locations for career opportunities (i.e., Form Los Angeles to New York, etc).
-4. Delaying marriage and starting a family. This trend has been going on for a few decades now but the push to buy a home usually is done for emotional reasons. With younger Americans delaying marriage and starting a family, the emotional need to buy is pushed further out.
It is too early to tell if these trends will carry through this decade into 2020 but there is little reason to believe it will change. The baby boomer retirement tsunami is going to happen no matter what. This by default will flood the market with housing inventory. The timing is bad since we have a giant pool of shadow inventory that still needs to clear out.
Let us now take a snapshot at the current U.S. housing market:
Source: Census
Over 52 million Americans �own� their home but carry a mortgage on the property. Another 23 million own their property free and clear. The majority are older Americans. Also, you have a large number of Americans in a negative equity position. Of the 52 million that own their home over 10 million are in a negative equity position. This trend has inserted a crushing blow to the overall home equity Americans have:
Source: Calculated Risk
The above chart was always a case study of why we were in a bubble even during the major price appreciation in real estate. Even during the housing bubble household home equity steadily declined as people leveraged to the max and also tapped money out of their housing ATM. Today this number is dramatically lower than the above chart shows because this also includes those who own their homes free and clear. If we simply looked at those with mortgages, we will find that many Americans have very little equity in their homes (forget about the fact that over 10 million would have to pay money to sell their homes).
This is why since the bubble burst in housing a large aspect for home buying has been with investors. The move up segment of buyers has been stunted because of the above reasons we mentioned for younger Americans. The shadow inventory remains elevated as foreclosure timelines are absolutely incredible:
The average foreclosure timeline for a home in Florida is over 1,000+ days! Nationwide we went from an average time of 253 days in 2007 to the current 674 days in 2011. Contrary to what is pushed in the media the housing market is in an utter mess. Banks have absolutely no idea how to deal with this mess so the path they have taken is that of least resistance and largest bailouts.
Another push for young buyers has been with low down payment FHA mortgages. As expected and as we have stated before, having a little down payment makes home buying like a call option. If a home goes up in value, then you win. If it goes down, as it has for many years now, then you simply walk away from the small premium. So let us now take a look at default rates for FHA loans:
Source: LPS
Not surprising but younger Americans who want to buy a home and do not have the savings to do so will usually opt for these loans that require only 3.5 percent down. Any little economic hiccup can throw things into a spiral and the last decade has turned the U.S. economy upside down like no other time except the Great Depression.
The future of the American housing market does depend largely on how well financially younger American families will do. Just because a retiring American selling his or her home would like a peak price for their property they are likely to find a market that is hungry for cheaper properties. The game has changed and those thinking that a miracle in housing is around the corner fail to understand the built in demographics of the system. It is also beneficial on a long-term basis to have affordable housing so a larger portion of discretionary income goes to creating jobs and moving the economy instead of having large portions of our society trading homes with one another and pretending that is economic growth.
http://www.doctorhousingbubble.com/f...e-projections/
Comment