 Tweet
Tweet
There is an interesting trend that continues to be a hallmark of the shadow inventory. It has barely moved since January of 2009. While overall visible MLS housing inventory peaked in 2007 it has been continuously falling since that time. Yet the shadow inventory remains inflated in spite of 3,000,000+ distressed properties being sold since January of 2009. Now why is that? This is something that we will get into later in the article. A handful of states, six to be exact, make up half of the current shadow inventory. Since current sales are dominated by lower priced homes you are seeing most of the housing action occurring in the distressed side of the inventory equation. However as the housing market flails forward, there is a backroom acknowledgment that until the shadow inventory clears out, there will be no healthy housing market.
Those that can are holding back but for what?
Aside from a smaller segment of the market, most people that are losing their homes are losing them involuntarily due to economic hardship. Those that can hold back are pulling inventory off the market for brighter days:
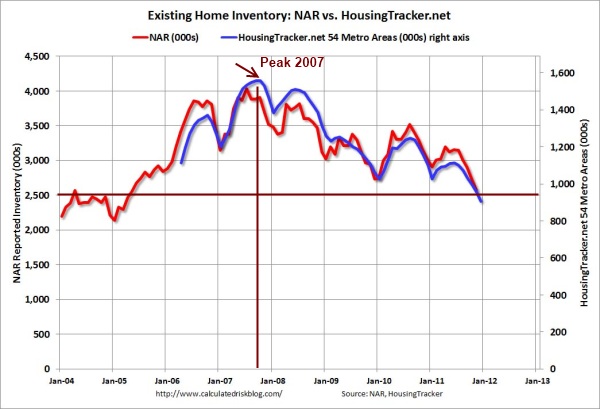
The above chart comes from the Calculated Risk Blog and highlights inventory from two different sources. The trend overall is very clear. Total visible housing inventory peaked in 2007 and has fallen steadily since that time. Now you would think that because of this movement prices would have stabilized but to the contrary. A large volume of sales has occurred with distressed properties since that time. The market is largely being driven by shadow inventory which slowly migrates into the visible inventory space.
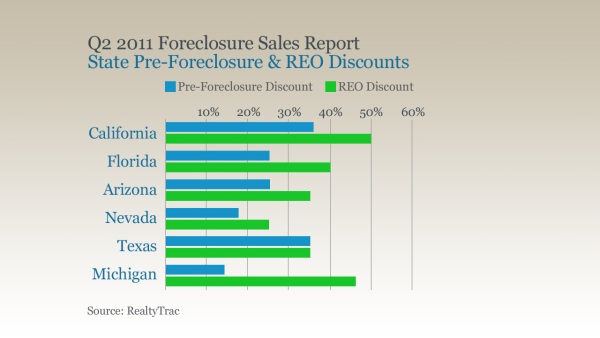
3 million distressed homes have sold since January of 2009 and these sell for a discount:
Yet shadow inventory remains stubbornly high because more distressed housing is coming onto the books at banks as the economy continues to waddle along. This is why behind the scenes the shadow inventory figures are still extremely high:
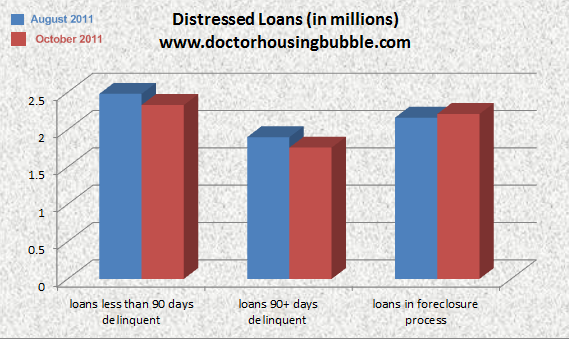
It depends how you measure the above. For some, a loan needs to be seriously delinquent and not showing up on the MLS. However this misses roughly 2,000,000 loans that are 30+ days late only itching to enter that seriously delinquent category. Cure rates are abysmal so it is likely a large number of these will enter the foreclosure process. In other words there is going to be major pricing pressure to the downside so it should be no surprise that the latest Case-Shiller data shows a new post-bubble low for home prices.
It should also come as no surprise that last year was a banner year for all cash home purchases. A report by Hanley Wood Market Intelligence showed that in 2011 38 percent of home buyers bought homes with all cash despite record low rates. Of course this is being driven by investors looking for bargains in many markets but also the broken balance sheets of many potential home buyers who are opting to rent. Low rates can only do so much and this is another gamble that is being subsidized.
Don�t think that low rates on the 30 year fixed rate mortgage are all good especially when the Fed is artificially holding rates low and mispricing risk
�(Businessweek) This system simultaneously drives down mortgage rates on guaranteed loans and permits lenders to back them with minimal capital. This encourages banks and other deposit-taking institutions to hold more mortgage securities than would normally be justifiable, a recipe for both bubbles and bailouts.
Rather than diversifying risk, these government policies promote a concentration of risk. A single national event, specifically an abrupt increase in interest rates, would adversely affect prices for this entire asset class. Banks may attempt to hedge this risk, but hedging gains and losses can be uneven, particularly in the case of volatile markets or when many participants are forced to sell at the same time. For example, Fannie and Freddie have had a combined $17 billion in hedging-related losses during the first three quarters of 2011.�
Shadow inventory will continue to be a big drag on the market deep into 2012. And what were the six big states for shadow inventory? (the first 5 are the largest states by population - the 6 have a combined 2010 census of approximately 134M out of a national total of 310M.)
http://www.doctorhousingbubble.com/s...dow-inventory/
Those that can are holding back but for what?
Aside from a smaller segment of the market, most people that are losing their homes are losing them involuntarily due to economic hardship. Those that can hold back are pulling inventory off the market for brighter days:
The above chart comes from the Calculated Risk Blog and highlights inventory from two different sources. The trend overall is very clear. Total visible housing inventory peaked in 2007 and has fallen steadily since that time. Now you would think that because of this movement prices would have stabilized but to the contrary. A large volume of sales has occurred with distressed properties since that time. The market is largely being driven by shadow inventory which slowly migrates into the visible inventory space.
3 million distressed homes have sold since January of 2009 and these sell for a discount:
Yet shadow inventory remains stubbornly high because more distressed housing is coming onto the books at banks as the economy continues to waddle along. This is why behind the scenes the shadow inventory figures are still extremely high:
It depends how you measure the above. For some, a loan needs to be seriously delinquent and not showing up on the MLS. However this misses roughly 2,000,000 loans that are 30+ days late only itching to enter that seriously delinquent category. Cure rates are abysmal so it is likely a large number of these will enter the foreclosure process. In other words there is going to be major pricing pressure to the downside so it should be no surprise that the latest Case-Shiller data shows a new post-bubble low for home prices.
It should also come as no surprise that last year was a banner year for all cash home purchases. A report by Hanley Wood Market Intelligence showed that in 2011 38 percent of home buyers bought homes with all cash despite record low rates. Of course this is being driven by investors looking for bargains in many markets but also the broken balance sheets of many potential home buyers who are opting to rent. Low rates can only do so much and this is another gamble that is being subsidized.
Don�t think that low rates on the 30 year fixed rate mortgage are all good especially when the Fed is artificially holding rates low and mispricing risk
�(Businessweek) This system simultaneously drives down mortgage rates on guaranteed loans and permits lenders to back them with minimal capital. This encourages banks and other deposit-taking institutions to hold more mortgage securities than would normally be justifiable, a recipe for both bubbles and bailouts.
Rather than diversifying risk, these government policies promote a concentration of risk. A single national event, specifically an abrupt increase in interest rates, would adversely affect prices for this entire asset class. Banks may attempt to hedge this risk, but hedging gains and losses can be uneven, particularly in the case of volatile markets or when many participants are forced to sell at the same time. For example, Fannie and Freddie have had a combined $17 billion in hedging-related losses during the first three quarters of 2011.�
-California
-Florida
-Illinois
-New York
-Texas
-New Jersey
This shouldn�t come as a big surprise. Don�t be fooled by what is being displayed on the surface. Things are still fragile for our economy and 2012 is likely to prove a circus of a year in politics. In other words the soil is fertile for pandering, boneheaded economic policies, and promising the world nicely gift wrapped.-Florida
-Illinois
-New York
-Texas
-New Jersey
http://www.doctorhousingbubble.com/s...dow-inventory/
Comment