 Tweet
Tweet
The official double dip in home prices is not significant in the sense that it is a surprising revelation but will carry more traction because of the way the news cycle works. The press reports on what happened especially when it comes to economics and feeds the beast especially with bubbles. Virtually every large news outlet missed the most obvious and biggest housing bubble ever witnessed by humankind. During the meteoric rise in housing prices the press fed into the feeding frenzy by drawing more and more buyers into the housing game either through cable shows erotically framing granite countertops or ordinary people making a mint by simply slapping on a coat of magenta paint to the living room wall. This is typically how manias work until they reach a tipping point. After the bubble burst the press reported on the �shocking� crash and fed into this part of the cycle. But for well over a year it has been stories about housing rebounding. The fact that we have now officially double dipped will create another news cycle reflecting the continued decline in home values. What you as a thoughtful reader and follower of the housing market should ask is why isn�t the press actually examining the connection between home values and actual household incomes? This is the absolutely most important item never examined. This is the most obvious item to explore from a big news story since mortgages are paid by W2 wages, not by some alchemy of finances or HD cameras.
Case Shiller double dip and the new news cycle
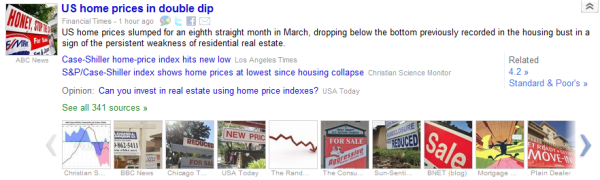
I follow a variety of sources in regards to news and as the above picture highlights, the press is running full steam ahead with the double dip. We�ve been tracking the massive amount of shadow inventory and large pipeline of troubled homes so the question of a double dip was never in doubt. The question was rather one of timing. It is now clear that the new bottom in housing prices, both in nominal and real levels is occurring fluidly today. This is now an active cycle low. The only question in doubt at this point is how much further will home prices fall before reaching an absolute bottom? I don�t think we can answer that question until we figure out how low household wages will go (or move up if the economy turns around). This is really the wild card in how deep this double dip goes.
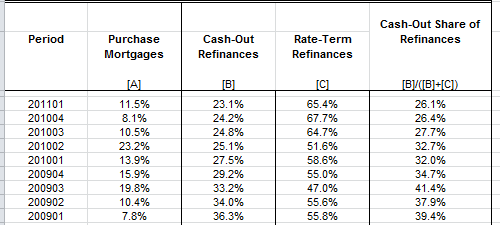
You also have the psychological component of home values tanking again. If you recall, the double recessions of the early 1980s started with a minor recession followed by a much deeper global recession. That recession was caused (on purpose) by hiking interest rates to curb global inflation. Today the Federal Reserve is doing everything it can to get people to borrow so long as they have household income to justify the borrowing. And therein lies the rub since the days of NINJA loans is long gone. The borrowing that is occurring is stimulating an already overly suffocating part of our economy in finance. For example, a large part of all recent mortgage activity is with refinancing:
Source: FHFA
This is really telling data here. The above looks at loan activity by quarter. Take the second quarter in 2005. What was going on at that time?
The troubling reality is that most Americans use their homes as the largest store of wealth. Home prices are rapidly going to a nominal lost decade (the real lost decade measured with inflation is already here):
Source: Paper Economy
What does all of this mean going forward? From the data I�m seeing it is hard to keep the housing market inflated for a few reasons:
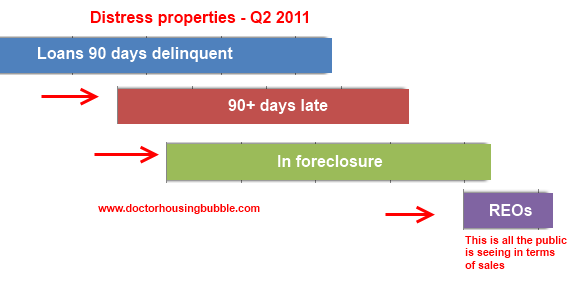
It is amazing to me that 600,000 to 700,000 REOs are on the market to purchase yet over 2 million homes are in actual foreclosure (another 4 million are delinquent). As I discussed in a previous article you have 675,000 loans that are in foreclosure and have made no payment for over 2 years! These are not even part of the REO inventory and a separate piece of the foreclosure pie. Who will purchase these homes? Investors are already losing steam because vacancy rates are soaring in many markets as investors outdo one another trying to flip to others and are also battling for the few renters in the area.
The double dip is a nationwide phenomenon. Actually, it is global and we are starting to see cracks in Canada and Australia and these places had bubbles even larger than the U.S. in some cases. Yet some markets especially in high priced states like California will crash. Crash is such a vague term so let me define. We already know that in the state home values are down in aggregate by 50 percent. Yet some markets (all have corrected) are still inflated. This is where we will see home prices crash. When I say crash I mean a decline of at least 10 percent from where we stand today. This is a large amount considering over one third of purchases are made with 3.5 percent down FHA insured loans. The drop is sufficient to wipe all equity out and put someone in a 5 to 10 percent underwater situation quickly if we factor in the selling costs as well. That is a raw deal no matter how you slice it especially when the underemployment rate in the state is still close to 23 percent.
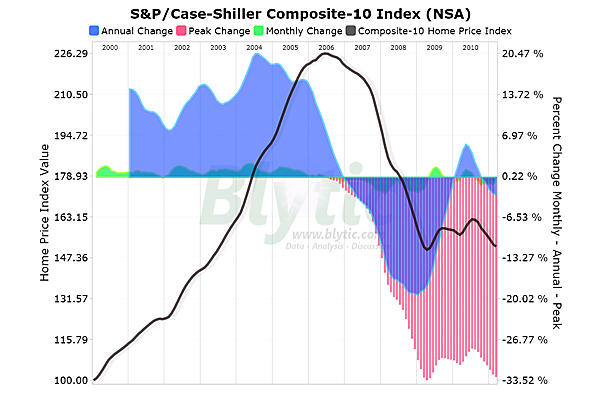
Take a look at the Los Angeles and Orange County markets:
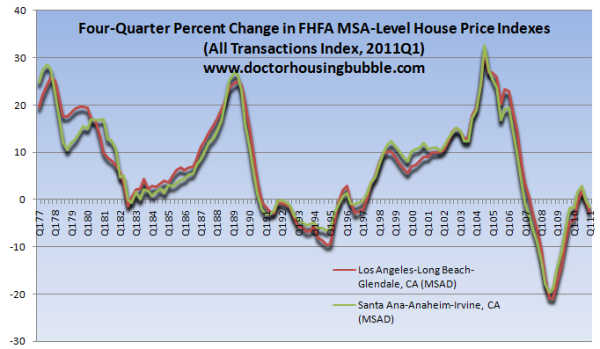
Source: FHFA
I picked the data above merely because it goes back to 1977. It is clear to see that this was the biggest bubble ever in the region but also the deepest crash. You see the early 1990s bubble but that is nothing compared to what we are going through. Keep in mind during that bubble pop actual real household incomes were going up. And you can see that home prices went up from 1994 all the way up to 2007. The dip in the early 1990s was minor. Then if you look further back at the 1980s you have over 20 years of psychological conditioning of how great of an investment real estate is in the Southern California area. Those days are over. Just like the double dip is shocking many this new reality is a game changer. No one ever said this housing correction would be quick. Four years later from the crash and we are reaching a new nominal low. How many more years do we need before the big news outlets connect housing to actual household wages?
http://www.doctorhousingbubble.com/f...main-stagnant/
Case Shiller double dip and the new news cycle
I follow a variety of sources in regards to news and as the above picture highlights, the press is running full steam ahead with the double dip. We�ve been tracking the massive amount of shadow inventory and large pipeline of troubled homes so the question of a double dip was never in doubt. The question was rather one of timing. It is now clear that the new bottom in housing prices, both in nominal and real levels is occurring fluidly today. This is now an active cycle low. The only question in doubt at this point is how much further will home prices fall before reaching an absolute bottom? I don�t think we can answer that question until we figure out how low household wages will go (or move up if the economy turns around). This is really the wild card in how deep this double dip goes.
You also have the psychological component of home values tanking again. If you recall, the double recessions of the early 1980s started with a minor recession followed by a much deeper global recession. That recession was caused (on purpose) by hiking interest rates to curb global inflation. Today the Federal Reserve is doing everything it can to get people to borrow so long as they have household income to justify the borrowing. And therein lies the rub since the days of NINJA loans is long gone. The borrowing that is occurring is stimulating an already overly suffocating part of our economy in finance. For example, a large part of all recent mortgage activity is with refinancing:
Source: FHFA
This is really telling data here. The above looks at loan activity by quarter. Take the second quarter in 2005. What was going on at that time?
Purchases: 40%
Cash-out refi: 40%
Rate-term refis: 20%
In other words a solid portion of the market involved boosting the economy via actual home purchases and folks yanking out money from cash-out refinancing. This was incredibly stimulating to economic growth even if it was all an illusory bubble. Now fast forward to the first quarter of 2011, the latest data points to:Cash-out refi: 40%
Rate-term refis: 20%
Purchases: 11.5%
Cash-out refi: 23.1%
Rate-term refis: 65.4%
Now think about what this data signifies, the market tanked in full force in early 2008 and the Federal Reserve went into full action. Yet purchase mortgage activity never really increased much but refinancing sure did. Who did this benefit?Cash-out refi: 23.1%
Rate-term refis: 65.4%
-Those that had mortgages but really weren�t necessarily in financial trouble
-Banks/servicers as they charge a good portion for each refinance and churning loan activity (i.e., closing costs, etc)
Look at more normal times in the 1990s like in 1996 when 78 percent of loans were for purchase. Purchase mortgages should always be the dominant force of the market (i.e., above 50 percent). That has radically changed. It is just interesting to see the data reflect what we already know and that is people are buying lower priced homes (and keep in mind in some market like in Arizona half the purchases are done with investors so there is no need for a mortgage and that will not show up in the chart above). This is a really odd market we are in but this is clearly a bubble that is still popping.-Banks/servicers as they charge a good portion for each refinance and churning loan activity (i.e., closing costs, etc)
The troubling reality is that most Americans use their homes as the largest store of wealth. Home prices are rapidly going to a nominal lost decade (the real lost decade measured with inflation is already here):
Source: Paper Economy
What does all of this mean going forward? From the data I�m seeing it is hard to keep the housing market inflated for a few reasons:
-1. Home prices are still too high in many regions relative to household incomes
-2. The Fed has already pushed mortgage rates as low as it can without dangerously expanding its balance sheet (it currently holds over $1 trillion in mortgage backed securities alone which the market was unwilling to purchase)
-3. The religious belief that home values never go down is largely shattered across the country. Hard to bring back faith when it is lost especially when it is a faith based on economics.
These forces combined make the future largely uncertain for home values but I do think they all point to lower prices (this could be nominal or inflation adjusted and we are getting both right now). Real mortgage interest rates should be anywhere from 150 to 250 basis points higher if the Fed were to step out. The Federal Reserve is risking larger consequences than merely seeing home values falter. Psychologically people will now be hearing story after story about the double dip and this will create a feedback loop. This is coming at a bad time when the backlog of shadow inventory is legendary:-2. The Fed has already pushed mortgage rates as low as it can without dangerously expanding its balance sheet (it currently holds over $1 trillion in mortgage backed securities alone which the market was unwilling to purchase)
-3. The religious belief that home values never go down is largely shattered across the country. Hard to bring back faith when it is lost especially when it is a faith based on economics.
It is amazing to me that 600,000 to 700,000 REOs are on the market to purchase yet over 2 million homes are in actual foreclosure (another 4 million are delinquent). As I discussed in a previous article you have 675,000 loans that are in foreclosure and have made no payment for over 2 years! These are not even part of the REO inventory and a separate piece of the foreclosure pie. Who will purchase these homes? Investors are already losing steam because vacancy rates are soaring in many markets as investors outdo one another trying to flip to others and are also battling for the few renters in the area.
The double dip is a nationwide phenomenon. Actually, it is global and we are starting to see cracks in Canada and Australia and these places had bubbles even larger than the U.S. in some cases. Yet some markets especially in high priced states like California will crash. Crash is such a vague term so let me define. We already know that in the state home values are down in aggregate by 50 percent. Yet some markets (all have corrected) are still inflated. This is where we will see home prices crash. When I say crash I mean a decline of at least 10 percent from where we stand today. This is a large amount considering over one third of purchases are made with 3.5 percent down FHA insured loans. The drop is sufficient to wipe all equity out and put someone in a 5 to 10 percent underwater situation quickly if we factor in the selling costs as well. That is a raw deal no matter how you slice it especially when the underemployment rate in the state is still close to 23 percent.
Take a look at the Los Angeles and Orange County markets:
Source: FHFA
I picked the data above merely because it goes back to 1977. It is clear to see that this was the biggest bubble ever in the region but also the deepest crash. You see the early 1990s bubble but that is nothing compared to what we are going through. Keep in mind during that bubble pop actual real household incomes were going up. And you can see that home prices went up from 1994 all the way up to 2007. The dip in the early 1990s was minor. Then if you look further back at the 1980s you have over 20 years of psychological conditioning of how great of an investment real estate is in the Southern California area. Those days are over. Just like the double dip is shocking many this new reality is a game changer. No one ever said this housing correction would be quick. Four years later from the crash and we are reaching a new nominal low. How many more years do we need before the big news outlets connect housing to actual household wages?
http://www.doctorhousingbubble.com/f...main-stagnant/
I was told to leave you alone
My father said come on home
My doctor said take it easy
But your lovin' is much too strong
I'm added to your
churn, churn, churn
(apologies to Ms Aretha)
My father said come on home
My doctor said take it easy
But your lovin' is much too strong
I'm added to your
churn, churn, churn
(apologies to Ms Aretha)