 Tweet
Tweet
Multiple sets of indicators are clearly showing that the housing market is entering a second winter. Home prices are inching closer to cycle lows and indicators of housing distress are rampant throughout the country. Home prices during the troubling five years of 1928 through 1933 saw a decline of 25.9 percent nationwide and this was during the Great Depression. The latest Case-Shiller data shows that home prices in the 20 City and 10 City composite measures are down by 32 percent from their 2006 peak. This is now nominally the worst housing correction since the Great Depression. The continuing correction in housing is economically challenging middle class households in ways vastly different from those during the Great Depression. What is troubling about the new cycle lows is that the liquidity injected into the banking system by the Federal Reserve simply delayed the inevitable while diverting precious resources to a broken financial system. The painful lesson of the new reality is that household income, the gas in the engine, is simply too low to support prices even at today�s new lower levels.
The Great Housing Crash of 2006
Source: Economist
Many were early to call a bottom in the housing market last year. It all varied on what data you were looking at. It was true that the home buyer tax credits and the Federal Reserve pushing mortgage rates lower created an artificial stimulus that did revive the market briefly. You should ask yourself what these actions covered. The home buyer tax credits and the Fed intervening made home purchasing cheaper only because an artificial floor was temporarily placed. Home prices for many years have not been dictated by the market in the sense of an open transparent market where sellers and buyers compete for goods in a somewhat balanced system. Home prices have so many artificial carrots and glistening bells and whistles that the real price is hard to ascertain. Imagine the government stepping in and offering a giant tax credit for buying SUVs. It is logical to assume that at least initially, sales will increase as the real price of the vehicle is pushed lower. Yet in the end market prices have to reflect more steady measures. As the tax credit evaporated and the Federal Reserve�s mortgage buying spree ended, the reality was American households simply do not have the income to support current prices. You can see the recent up and down here:
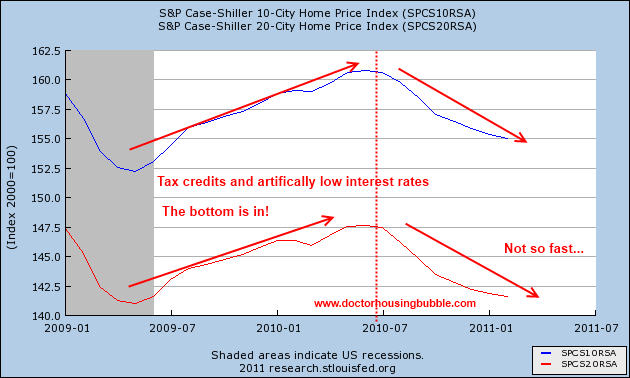
Home prices have been falling steadily since the summer of 2010. The fact that we still have close to 7,000,000 homes in the shadow inventory tells us that we still have a long way to go before any normal housing market is restored. This by far is the worst housing collapse ever and it is still ongoing. This isn�t some closed chapter in our history books. We are still experiencing the actual correction. You can see from the above charts and gather a sense of how deep this correction is. Or maybe this chart can help:
Source: Economy.com
Keep in mind the above chart is inflation adjusted while the 25.9 percent correction is based on nominal levels. No matter how you slice this correction it is the worst on record. To get closer to the baseline prices would need to fall 43 percent from the 2006 peak. A number that seemed preposterous only a few years ago is now within touching distance.
Homeownership increase causes housing correction more widespread pain
Source: Census
When the Great Depression hit roughly 46 percent of Americans owned their home. Most of the mortgage debt was modest although on much shorter balloon payment deadlines that were exacerbated by the collapse. When the bubble unfolded in our current crisis nearly 70 percent of Americans were homeowners with massive amounts of mortgage debt. Most Americans derive their net worth from their home. So a collapse in housing values has sent a ripple through the balance sheets of the vast majority of Americans. Even if you are part of the one-third of homeowners with no mortgage your home values just cratered 32 percent on a nationwide basis. Depending on where you live this could be much worse or better. However it is likely you have lost a good amount of housing equity.
The problem itself isn�t so much that homeownership shot up to 70 percent but how it was financed. As many of you are well aware in the last decade U.S. median household growth was non-existent. Families are earning what they did going back to the late 1990s. Yet the cost of a gallon of gas is now up over $4 in many areas, local and state governments are raising taxes for dwindling budgets, medical care costs are soaring, and the cost to feed your family is also sky high. So the fact that home prices rose in light of all of this is a stunning reflection of the mania we have lived through. There will be books written on the insanity that is the U.S. housing market and history will not look favorably on many of our actions but the truth is history is still being written.
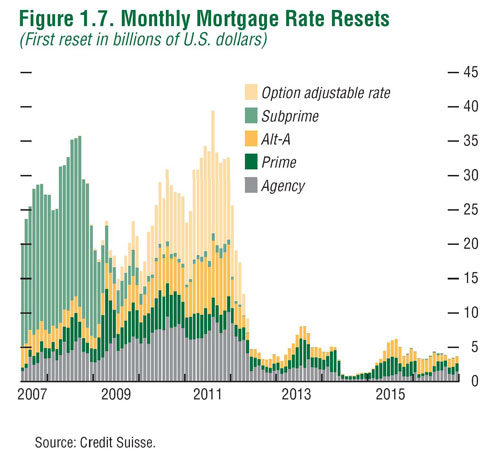
The adjustment in the housing market is still fluid and dynamic. I recall reading an article in the summer of 2009 showing some prescient insight into the market. In the article this chart was produced:
Source: Moody�s
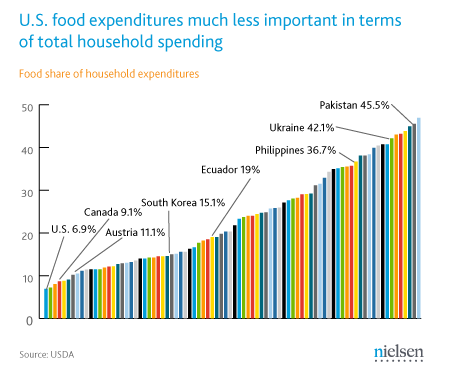
As we all know the cost of food is and has been going up yet income has remained stagnant or has dropped. The amount that can be spent on housing by default decreases. The Fed has essentially focused on the borrowing side of the equation by trying to lower rates to adjust to this new lower income world. This artificial intervention by the Federal Reserve has harmed most Americans while favoring investment banks around the country who really are the only sector who benefit from inflated housing costs. Lower home prices are actually beneficial to the one-third that rent. The one-third that own but have no mortgage are likely to not change their spending habits. It is the two-third that own and have a mortgage that are largely in play. If people purchase carefully and actually treat a home as a place to live, then if prices dipped another 20 percent it would not matter. The narrative that home prices need support is largely a banking propaganda piece trying to keep inflated balance sheets propped up.
As more and more disposable income is taken up by items outside of housing the amount of money Americans can finance for purchasing a home dwindles. This is why the demand for lower priced homes is healthy while markets where jumbo loans are needed are basically groveling at the feet of the government for more subsidies to keep prices inflated. Why would these supposedly rich areas need subsidies? What is it to the rich family to pay a little more from their healthy income to a house payment? The answer is that these markets are largely giant shell games where cars are leased and jumbo mortgages reign supreme. No doubt there are very wealthy enclaves with real solid incomes but you have other areas like Culver City or Pasadena where much of the economy is a paper tiger. You have households making $100,000 to $150,000 a year living as if they made $300,000 and above.
What can we learn from the Great Depression housing market and the one we are currently living in? First, many of the safety nets absent from the Great Depression like giant handouts to banks, food stamps, unemployment insurance, the FDIC, and stronger government intervention have made things look much better. Yet this is like a storm ravaging your property and you being happy that you have insurance. Sure, the place is covered but someone is still going to pay for the cost. I have few qualms about unemployment insurance or even food assistance since these keep people from absolute destitute situations and in terms of costs, are relatively low. For example $64 billion was paid out in 2010 to 40,000,000 families through food assistance. This money is spent back into the economy immediately. To put this in perspective look at the absolute failure of the home buyer tax credit:
In the end home prices will continue to decline simply because no income growth has shown up in over a decade. Even if we do see income growth, we have to measure this with other rising costs like food and fuel. In the end, you can�t eat your house and maybe this is why the American Dream is now being redefined.
http://www.doctorhousingbubble.com/e...at-depression/
The Great Housing Crash of 2006
Source: Economist
Many were early to call a bottom in the housing market last year. It all varied on what data you were looking at. It was true that the home buyer tax credits and the Federal Reserve pushing mortgage rates lower created an artificial stimulus that did revive the market briefly. You should ask yourself what these actions covered. The home buyer tax credits and the Fed intervening made home purchasing cheaper only because an artificial floor was temporarily placed. Home prices for many years have not been dictated by the market in the sense of an open transparent market where sellers and buyers compete for goods in a somewhat balanced system. Home prices have so many artificial carrots and glistening bells and whistles that the real price is hard to ascertain. Imagine the government stepping in and offering a giant tax credit for buying SUVs. It is logical to assume that at least initially, sales will increase as the real price of the vehicle is pushed lower. Yet in the end market prices have to reflect more steady measures. As the tax credit evaporated and the Federal Reserve�s mortgage buying spree ended, the reality was American households simply do not have the income to support current prices. You can see the recent up and down here:
Home prices have been falling steadily since the summer of 2010. The fact that we still have close to 7,000,000 homes in the shadow inventory tells us that we still have a long way to go before any normal housing market is restored. This by far is the worst housing collapse ever and it is still ongoing. This isn�t some closed chapter in our history books. We are still experiencing the actual correction. You can see from the above charts and gather a sense of how deep this correction is. Or maybe this chart can help:
Source: Economy.com
Keep in mind the above chart is inflation adjusted while the 25.9 percent correction is based on nominal levels. No matter how you slice this correction it is the worst on record. To get closer to the baseline prices would need to fall 43 percent from the 2006 peak. A number that seemed preposterous only a few years ago is now within touching distance.
Homeownership increase causes housing correction more widespread pain
Source: Census
When the Great Depression hit roughly 46 percent of Americans owned their home. Most of the mortgage debt was modest although on much shorter balloon payment deadlines that were exacerbated by the collapse. When the bubble unfolded in our current crisis nearly 70 percent of Americans were homeowners with massive amounts of mortgage debt. Most Americans derive their net worth from their home. So a collapse in housing values has sent a ripple through the balance sheets of the vast majority of Americans. Even if you are part of the one-third of homeowners with no mortgage your home values just cratered 32 percent on a nationwide basis. Depending on where you live this could be much worse or better. However it is likely you have lost a good amount of housing equity.
The problem itself isn�t so much that homeownership shot up to 70 percent but how it was financed. As many of you are well aware in the last decade U.S. median household growth was non-existent. Families are earning what they did going back to the late 1990s. Yet the cost of a gallon of gas is now up over $4 in many areas, local and state governments are raising taxes for dwindling budgets, medical care costs are soaring, and the cost to feed your family is also sky high. So the fact that home prices rose in light of all of this is a stunning reflection of the mania we have lived through. There will be books written on the insanity that is the U.S. housing market and history will not look favorably on many of our actions but the truth is history is still being written.
The adjustment in the housing market is still fluid and dynamic. I recall reading an article in the summer of 2009 showing some prescient insight into the market. In the article this chart was produced:
Source: Moody�s
�(Moody�s) A number of indicators of housing have bottomed, and there are tantalizing signs that the descent in house prices is at least moderating. When all is said and done, this housing correction, easily the worst on record for the U.S., will see the national Case-Shiller� house price index fall nearly 40% from its 2006 peak. The correction will be not only deep but also lengthy, with the U.S. price index bottoming in the second quarter of 2010. The national price level will not regain its 2006 high until 2020, a peak-to-peak housing cycle of 14 years. Regions will vary substantially, however, with areas that saw prices rise most taking the longest to return.�
What is interesting is that the market did hit a bottom early in 2010. Yet what wasn�t accounted for was the double-dip in the housing market which is what we are now clearly in. The enormous backlog of shadow inventory will keep a steady stream of lower priced properties for years to come. I also find it interesting that the above chart is able to predict 12 years out and that California will see peak levels again in 2023. Frankly, I think projections going out more than 3 years for housing prices in this current market is similar to flipping a coin since all we can say with certainty is that home prices cannot go up with no significant income changes. People keep asking about certain financial ratios about when it would make sense to buy. Unfortunately we now live in a much more challenging financial world. The metrics now have to change completely. We are used to paying very little for food and fuel in relation to total household income. Other countries are used to paying more:As we all know the cost of food is and has been going up yet income has remained stagnant or has dropped. The amount that can be spent on housing by default decreases. The Fed has essentially focused on the borrowing side of the equation by trying to lower rates to adjust to this new lower income world. This artificial intervention by the Federal Reserve has harmed most Americans while favoring investment banks around the country who really are the only sector who benefit from inflated housing costs. Lower home prices are actually beneficial to the one-third that rent. The one-third that own but have no mortgage are likely to not change their spending habits. It is the two-third that own and have a mortgage that are largely in play. If people purchase carefully and actually treat a home as a place to live, then if prices dipped another 20 percent it would not matter. The narrative that home prices need support is largely a banking propaganda piece trying to keep inflated balance sheets propped up.
As more and more disposable income is taken up by items outside of housing the amount of money Americans can finance for purchasing a home dwindles. This is why the demand for lower priced homes is healthy while markets where jumbo loans are needed are basically groveling at the feet of the government for more subsidies to keep prices inflated. Why would these supposedly rich areas need subsidies? What is it to the rich family to pay a little more from their healthy income to a house payment? The answer is that these markets are largely giant shell games where cars are leased and jumbo mortgages reign supreme. No doubt there are very wealthy enclaves with real solid incomes but you have other areas like Culver City or Pasadena where much of the economy is a paper tiger. You have households making $100,000 to $150,000 a year living as if they made $300,000 and above.
What can we learn from the Great Depression housing market and the one we are currently living in? First, many of the safety nets absent from the Great Depression like giant handouts to banks, food stamps, unemployment insurance, the FDIC, and stronger government intervention have made things look much better. Yet this is like a storm ravaging your property and you being happy that you have insurance. Sure, the place is covered but someone is still going to pay for the cost. I have few qualms about unemployment insurance or even food assistance since these keep people from absolute destitute situations and in terms of costs, are relatively low. For example $64 billion was paid out in 2010 to 40,000,000 families through food assistance. This money is spent back into the economy immediately. To put this in perspective look at the absolute failure of the home buyer tax credit:
�(WSJ) The credit wasn�t great for taxpayers, either. IRS says it paid $26 billion in home buyer credits in 2009 and 2010, enough to cover the maximum $8,000 credit for more than 3 million buyers. (It says at least $513 million went for fraudulent claims. Some claimants hadn�t bought houses. Some filed twice. Some were under age 18 or incarcerated.)�
Let us not forget about the multi-trillion dollar elephant in the room regarding the bailouts to the unworthy and financially broken financial system. The fact that most Americans have their wealth in housing and this was turned into a speculative casino by Wall Street is incredibly irresponsible. The reality of the new home price lows should tell you really who the bailouts were targeted for.In the end home prices will continue to decline simply because no income growth has shown up in over a decade. Even if we do see income growth, we have to measure this with other rising costs like food and fuel. In the end, you can�t eat your house and maybe this is why the American Dream is now being redefined.
http://www.doctorhousingbubble.com/e...at-depression/


 )
)


Comment