 Tweet
Tweet
The way housing is measured through the Bureau of Labor and Statistics (BLS) is troubling because it completely understates what is really happening with actual home values. For many years, especially during the bubble I drew attention to this thorn of a fact because many in high places were pointing to the CPI as being stable and actually reflecting reality. The Federal Reserve prides itself with being masters of price stability. But what if you are not measuring what you claim to be measuring? That is what started to happen in 1983 when it came to housing. In 1983 the BLS shifted the way it calculated the housing portion of the CPI by using an owner�s equivalent of rent. In other words, how much would you get if you rent your house out. This flawed methodology has come back to bite us in many ways but was completely intentional. It is no coincidence that only one year before in 1982 the Garn�St. Germain Depository Institutions Act of 1982 was passed and this allowed for adjustable rate mortgages (ARMs) that understated the monthly payment but allowed home prices to inflate. By calculating a rental equivalent the BLS understated inflation for many years, especially during the bubble years. Part of this is cynical in nature to slam those on fixed incomes like Social Security that actually depend on cost of living adjustments. If inflation doesn�t exist, then no cost of living adjustments. The wealthy do not rely on these little items so it is inconsequential but the majority of American families do depend on this data being accurate. Let us take a look at how flawed this measure is.
The BLS measure of housing
Source: The Mess that Greenspan Made
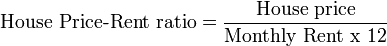
The above chart highlights the massive disconnect between the CPI and actual home values. You see that in the 1980s we did suffer a minor housing bubble which led to the savings and loans crisis. Yet that was small relative to what we faced a decade later starting in 1997. From 1997 to 2007 the CPI completely missed the once in a lifetime housing bubble. How did this happen? Well think about what the owner�s equivalent of rent (OER) measures. It basically measures what you would pay in rent for the home you are living in. Well this completely misses the fact that ARMs in the flavor of option ARMs for example actually allowed people to pay $500,000 for a tiny cardboard box that would rent for $1,000 or less. The real price of the home with a 30 year fixed mortgage actually carries a much higher cost, possibly of $3,000 to $4,000 a month. This is why price-to-rent ratios absolutely matter. If our central bank is going to make decade long monetary changes they should be using metrics that actually measure reality instead of some biased approach.
If the CPI understated the housing bubble nationwide you can only imagine what it did in bubble states like California. The year-over-year changes I believe highlight this disconnect clearly:
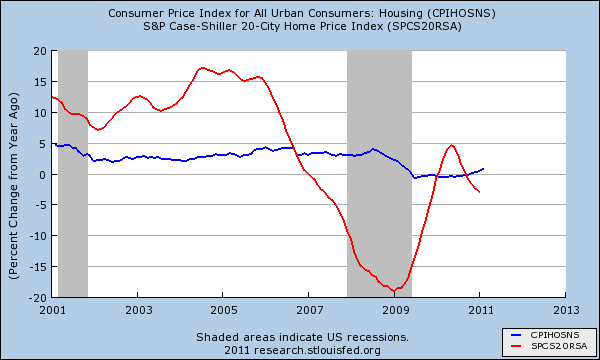
I decided to breakout the CPI housing component and measure it against the Case-Shiller 20 City Home Price Index. Now keep in mind what each of these items is focusing on. The Case-Shiller Index measures repeat home sales for the same home. This is one of the most accurate ways of measuring home prices in my opinion because you are looking at the same home over time. The blue line looks at the CPI housing component. It is important to note that housing makes up over 40 percent of the index so slight changes here impact the entire weighting of the CPI.
You can see for yourself that from 2001 the Case-Shiller was showing annual home price changes of 10 to over 15 percent! Yet the CPI never registered an annual increase of higher than 5 percent! In fact in many years it was registering annual changes of 2 or 3 percent which is completely absurd. Yet rents over this time did run sideways because people who pay rent actually use real world wages and in the real world, incomes went stagnant. Plus, why would you rent when anyone can play the housing lottery? Go in with nothing down and see what happens. The only reason the actual price of the home soared was the introduction of toxic mortgages with high leverage, the Federal Reserve artificially holding interest rates low, and a basic sense of graft and speculation throughout the entire country.
Now we already know what happened. But what is interesting is what is now happening. Rents initially started falling as the recession started which is to be expected. But rents seem to be ebbing higher right now even as home prices fall. Why is that?
The Federal Reserve prides itself with price stability. If that is the case, it needs to base decisions on metrics that actually measure what is happening in real time. That is, at one point nearly 70 percent of American households owned their home, with a mortgage mind you, yet they were using rental equivalency as a way to value a home? Those in these places will claim economists back these metrics but these are the same economists that missed the technology and housing bubbles and many who are hired by big investment banks. Two for two in that arena and not exactly unbiased.
Yet another point I would like to make is the fact that 30 to 40 percent of all purchases (depending on the market) are being conducted with FHA insured loans. These only require 3.5 percent down and the majority of these buyers are putting that amount down. Yet the real estate industry has pushed policies to keep selling fees up to 5 or 6 percent. In other words, all the tens of thousands of people buying today are starting from a negative equity position. If it costs 5 to 6 percent to sell off the top and you only put 3.5 percent down, you are in a negative equity spot. And what if home prices move lower as they are?
But let us look at another measure of housing for Los Angeles and add it to the graph above:
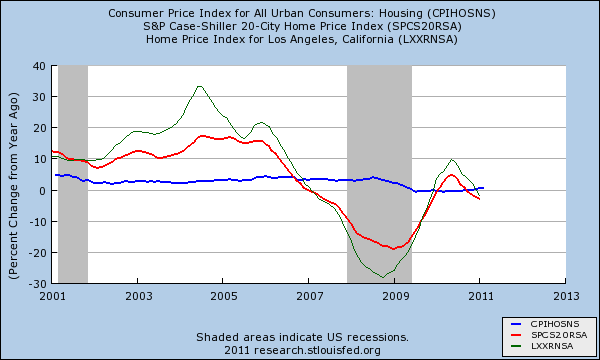
Look at the Home Price Index (HPI) for L.A. which is conservative but even with that, you can see that in one year the HPI for Los Angeles went up by a mind boggling 30 percent! Yet you can see the blue line CPI just moving sideways like a crab. As they say, don�t believe everything you read or hear.
http://www.doctorhousingbubble.com/h...housing-costs/
The BLS measure of housing
Source: The Mess that Greenspan Made
The above chart highlights the massive disconnect between the CPI and actual home values. You see that in the 1980s we did suffer a minor housing bubble which led to the savings and loans crisis. Yet that was small relative to what we faced a decade later starting in 1997. From 1997 to 2007 the CPI completely missed the once in a lifetime housing bubble. How did this happen? Well think about what the owner�s equivalent of rent (OER) measures. It basically measures what you would pay in rent for the home you are living in. Well this completely misses the fact that ARMs in the flavor of option ARMs for example actually allowed people to pay $500,000 for a tiny cardboard box that would rent for $1,000 or less. The real price of the home with a 30 year fixed mortgage actually carries a much higher cost, possibly of $3,000 to $4,000 a month. This is why price-to-rent ratios absolutely matter. If our central bank is going to make decade long monetary changes they should be using metrics that actually measure reality instead of some biased approach.
If the CPI understated the housing bubble nationwide you can only imagine what it did in bubble states like California. The year-over-year changes I believe highlight this disconnect clearly:
I decided to breakout the CPI housing component and measure it against the Case-Shiller 20 City Home Price Index. Now keep in mind what each of these items is focusing on. The Case-Shiller Index measures repeat home sales for the same home. This is one of the most accurate ways of measuring home prices in my opinion because you are looking at the same home over time. The blue line looks at the CPI housing component. It is important to note that housing makes up over 40 percent of the index so slight changes here impact the entire weighting of the CPI.
You can see for yourself that from 2001 the Case-Shiller was showing annual home price changes of 10 to over 15 percent! Yet the CPI never registered an annual increase of higher than 5 percent! In fact in many years it was registering annual changes of 2 or 3 percent which is completely absurd. Yet rents over this time did run sideways because people who pay rent actually use real world wages and in the real world, incomes went stagnant. Plus, why would you rent when anyone can play the housing lottery? Go in with nothing down and see what happens. The only reason the actual price of the home soared was the introduction of toxic mortgages with high leverage, the Federal Reserve artificially holding interest rates low, and a basic sense of graft and speculation throughout the entire country.
Now we already know what happened. But what is interesting is what is now happening. Rents initially started falling as the recession started which is to be expected. But rents seem to be ebbing higher right now even as home prices fall. Why is that?
-1. As more people lose their homes, they are seeking the only option they may have and that is a rental.
-2. Many cannot afford to buy and the only option available is government backed loans that at the very least, look at income which has been stagnant.
-3. You may have people making a more intentional decision to rent instead of buying because of the pain that occurred with the current housing market.
This is temporary in my view but could last a few years until the distressed inventory is worked out. We have never had so many people lose their homes on a nationwide scale. Right now all we are measuring is what someone would pay to rent their own home. For two full decades the entire measure was a sham and all it took was one mega housing bubble to distort the entire measure. The chart above is clear and shows home prices going down and rents slightly moving up on a nationwide basis. Yet other items like energy, food, and healthcare are eating up a larger portion of families� disposable income. The CPI measure does not accurately reflect what is happening with housing values, even today.-2. Many cannot afford to buy and the only option available is government backed loans that at the very least, look at income which has been stagnant.
-3. You may have people making a more intentional decision to rent instead of buying because of the pain that occurred with the current housing market.
The Federal Reserve prides itself with price stability. If that is the case, it needs to base decisions on metrics that actually measure what is happening in real time. That is, at one point nearly 70 percent of American households owned their home, with a mortgage mind you, yet they were using rental equivalency as a way to value a home? Those in these places will claim economists back these metrics but these are the same economists that missed the technology and housing bubbles and many who are hired by big investment banks. Two for two in that arena and not exactly unbiased.
Yet another point I would like to make is the fact that 30 to 40 percent of all purchases (depending on the market) are being conducted with FHA insured loans. These only require 3.5 percent down and the majority of these buyers are putting that amount down. Yet the real estate industry has pushed policies to keep selling fees up to 5 or 6 percent. In other words, all the tens of thousands of people buying today are starting from a negative equity position. If it costs 5 to 6 percent to sell off the top and you only put 3.5 percent down, you are in a negative equity spot. And what if home prices move lower as they are?
But let us look at another measure of housing for Los Angeles and add it to the graph above:
Look at the Home Price Index (HPI) for L.A. which is conservative but even with that, you can see that in one year the HPI for Los Angeles went up by a mind boggling 30 percent! Yet you can see the blue line CPI just moving sideways like a crab. As they say, don�t believe everything you read or hear.
http://www.doctorhousingbubble.com/h...housing-costs/


Comment