 Tweet
Tweet
January 12, 2011 - Reflecting Back on 2010:
The last of the BEA GDP reports issued during 2010 indicated that the "real final sales of domestic product" were growing at an anemic 0.9% rate during both the second and third quarters of 2010. This number is calculated by reducing the headline GDP number by the net amount of goods being added to manufacturing inventories (and therefore not being sold to end consumers). Their characterization of the number as the "real final sales" within the economy is telling, and a 0.9% annualized growth rate over the course of the six middle months of the year is statistically indistinguishable from a dead flat economy.
However mediocre that growth may have been, at the end of 2010 the data that we track was materially weaker. The on-line consumers that we track still appear to be reluctant to take on new debt, and they remain cautious in their expectations for the economy in 2011. The heavily reported increases in holiday spending came primarily from reductions in personal savings rates, and that holiday "feel-good" spending may ultimately turn out to be merely brought forward from the first quarter of 2011 -- similar to holiday dietary indulgences preceding fervently resolved first quarter diets. In any event, the consumers that we track are still contracting their year-over-year discretionary durable goods purchases at levels that indicate that something is still seriously amiss in this economy.
A look at our Contraction Watch shows that our Daily Growth Index remained in year-over-year contraction from the middle of January through the end of the year:
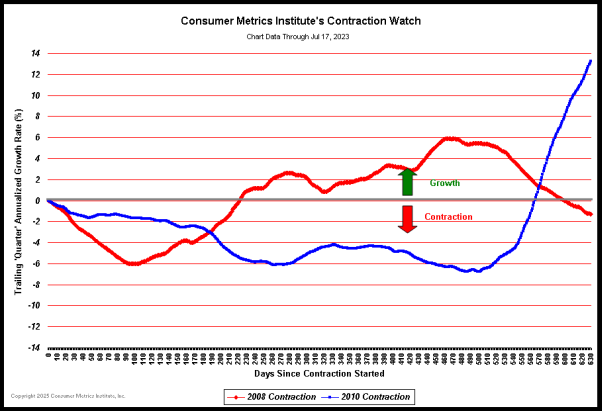
In the above chart the day-by-day courses of the 2008 and 2010 contractions in our Daily Growth Index are plotted in a superimposed manner with the plots aligned on the left margin at the first day during each event that our Daily Growth Index went negative. The plots then progress day-by-day to the right, tracing out the changes in the daily rate of contraction in consumer demand for the two events. The 2010 contraction event is now very nearly a year old, dating back to January 15, 2010. Although the chart clearly bottomed at about 9 months into the contraction (at roughly 270 days), the rise since that bottom has been neither steady nor substantial. In fact, there is no way to forecast when the indicated contraction will end based solely on the recent course of the blue line.
Frankly, our greatest disappointment in 2010 was how even the feeble 0.9% growth rates of "real final sales of domestic product" during the second and third quarters began to diverge significantly from the much weaker data that we track. The divergences started in the second quarter and widened during the third -- with early consensus expectations for the fourth quarter of 2010 pointing to divergences that likely continued through the end of the year.
We have taken from this experience a number of key lessons. These lessons have helped us understand that 2010 was a year of extraordinary distortions in the sources of economic growth in the U.S. economy. Even though it was the fourth consecutive year of unprecedented governmental intervention in the economy, this time the interventions were not targeted exclusively at rescuing financial institutions, auto makers and the housing market. By the second quarter of 2010 the full impact of both a wide range of stimulus spending and the defacto devaluation of the dollar was supplanting the consumer as the primary (and traditional) source of economic growth in the U.S. economy.
The shift to non-consumer sources of economic growth was clearly not the sole reason for the divergence between our indexes and the commonly reported measurements of the economy. By the third quarter we began to understand that the demographics of the consumers most likely to buy on-line were the same as those households most severely impacted by the recession. Unwittingly, some of the previously identified sampling biases in our data collection methodologies turned out to be much more significant than we might have suspected. Simply put, young and highly educated members of generations "X" and "Y" were particularly vulnerable to the hallmarks of this recession: entry level job losses and vanishing home equity.
Reflecting back on 2010, we can offer a number of observations directly from our data:
► GDP growth rates can be significantly impacted by non-consumer line items. Manufacturers building inventory, export growth, increased governmental spending and (counter-intuitively) consumer cut-backs on imported goods have all increased the GDP during portions of 2010 even as "real final" consumer commerce remained relatively flat.
► This recession was not a shared experience. Some consumers were especially hard hit by the downturn, just as they may have been the very same demographics that benefited the most from the expansion that led up to the 2007 peak. Unfortunately, the consumers who provide the transactions that we capture appear to be disproportionately among those most severely impacted by this recession.
► At year-end 2010 consumers were still cautious about the long term. In effect, the massive stimulus applied by the government during 2010 still didn't significantly improve longer term consumer confidence. Households are still deleveraging, albeit at a moderated pace. Consumers are still reacting to their own personal (and highly localized) assessments of the employment and housing markets, and they currently see no reason to significantly change their new-found conservative behaviors.
► Recession-fatigued consumers can self-medicate with holiday spending while still adhering to long term outlooks. December consumer confidence surveys clearly indicate that consumers are not yet convinced that the "recovery" is real or sustainable. A corollary to that observation is that retail sales surveys can be a misleading indication of the quality of commerce.
We can also offer some other general economic observations more broadly hinted at in our data:
► Infrastructure spending by governments is poor way to stimulate the economy. Repaving roads is a great way to spend vast sums of money on asphalt and concrete. It is a less efficient way to create quality long term jobs, revitalize the housing market or (evidently) help the consumers we track.
► Corporate earnings can be a misleading indication of the health of national commerce. Major U.S. corporations are in a privileged position in the economic food chain, with access to overseas markets, commercial paper, cheap loans, ruthless human resources departments, governmental contracts and stimulus monies. The people actually creating new jobs don't have such access. This is the business corollary to the "not a shared experience" mentioned above -- and it directly impacts the vast majority of the on-line merchants that provide the flip side of the consumer transactions we track.
► In time the unemployed simply disappear. They transform into students, the underemployed, the "discouraged," the prematurely retired or the chronically starving self-employed. Compared to the 1930's however, a surviving second household income has often mitigated the human suffering -- even as upside-down mortgages have prevented the mobility necessary to pursue elusive jobs. Many of the households caught in those binds are part of the "tech-savvy" cohort of on-line shoppers that we have tracked since 2004.
► Rescuing banks does not stimulate the economy. Saving banks may be necessary to prevent economic Armageddon, but it is not sufficient (in and of itself) to ensure a self-sustaining recovery. When provided with enough taxpayer cash to be both liquid and solvent, banks will promptly act in their own self interest. And changing regulatory benchmarks and/or accounting rules only facilitates that behavior. Our data includes the impact of the housing sector on the economy, and rescuing the banks has clearly not revitalized that industry.
► Ben Bernanke can't force people to borrow money that they don't want. And as mentioned above, he also apparently can't force banks to lend money they would rather use for other purposes, especially if all the highly qualified borrowers don't need any more debt. Over the past three years the Fed has discovered the limits to what "policy" can do, and the quality shift in the transactions we track indicates that our consumers still have no interest in leveraging back up.
► By "feeling the economic pain" among their constituents, politicians have promised results they don't have the means to deliver. Blame this political empowerment on Keynes, although it has certainly created a nice gig for Alan Greenspan and his successors. The problem is that now the "policy" cupboard has gone bare. Fortunately, Lincoln was right: you can't fool all of the people all of the time. Deep down the public knows that politicians can't really fix things -- especially if gridlock is setting in. Unlike 2008, this year our data never did see a substantial uptick after the electoral "FUD" (Fear, Uncertainty and Doubt) was resolved. Our consumers seem to know that -- self medicated holiday cheer aside -- the macro picture isn't going to change anytime soon.
We are in the business of collecting data about on-line consumer transactions for discretionary durable goods. We're not going to change what we do (as some have suggested) when the GDP stops tracking our on-line consumers or when the housing market becomes irrelevant within the latest quarter of economic data. Our job will remain the publication of what we collect, however contrary that data may be. And right now that data is materially weaker that many people would like to believe.
http://www.consumerindexes.com/
The last of the BEA GDP reports issued during 2010 indicated that the "real final sales of domestic product" were growing at an anemic 0.9% rate during both the second and third quarters of 2010. This number is calculated by reducing the headline GDP number by the net amount of goods being added to manufacturing inventories (and therefore not being sold to end consumers). Their characterization of the number as the "real final sales" within the economy is telling, and a 0.9% annualized growth rate over the course of the six middle months of the year is statistically indistinguishable from a dead flat economy.
However mediocre that growth may have been, at the end of 2010 the data that we track was materially weaker. The on-line consumers that we track still appear to be reluctant to take on new debt, and they remain cautious in their expectations for the economy in 2011. The heavily reported increases in holiday spending came primarily from reductions in personal savings rates, and that holiday "feel-good" spending may ultimately turn out to be merely brought forward from the first quarter of 2011 -- similar to holiday dietary indulgences preceding fervently resolved first quarter diets. In any event, the consumers that we track are still contracting their year-over-year discretionary durable goods purchases at levels that indicate that something is still seriously amiss in this economy.
A look at our Contraction Watch shows that our Daily Growth Index remained in year-over-year contraction from the middle of January through the end of the year:
In the above chart the day-by-day courses of the 2008 and 2010 contractions in our Daily Growth Index are plotted in a superimposed manner with the plots aligned on the left margin at the first day during each event that our Daily Growth Index went negative. The plots then progress day-by-day to the right, tracing out the changes in the daily rate of contraction in consumer demand for the two events. The 2010 contraction event is now very nearly a year old, dating back to January 15, 2010. Although the chart clearly bottomed at about 9 months into the contraction (at roughly 270 days), the rise since that bottom has been neither steady nor substantial. In fact, there is no way to forecast when the indicated contraction will end based solely on the recent course of the blue line.
Frankly, our greatest disappointment in 2010 was how even the feeble 0.9% growth rates of "real final sales of domestic product" during the second and third quarters began to diverge significantly from the much weaker data that we track. The divergences started in the second quarter and widened during the third -- with early consensus expectations for the fourth quarter of 2010 pointing to divergences that likely continued through the end of the year.
We have taken from this experience a number of key lessons. These lessons have helped us understand that 2010 was a year of extraordinary distortions in the sources of economic growth in the U.S. economy. Even though it was the fourth consecutive year of unprecedented governmental intervention in the economy, this time the interventions were not targeted exclusively at rescuing financial institutions, auto makers and the housing market. By the second quarter of 2010 the full impact of both a wide range of stimulus spending and the defacto devaluation of the dollar was supplanting the consumer as the primary (and traditional) source of economic growth in the U.S. economy.
The shift to non-consumer sources of economic growth was clearly not the sole reason for the divergence between our indexes and the commonly reported measurements of the economy. By the third quarter we began to understand that the demographics of the consumers most likely to buy on-line were the same as those households most severely impacted by the recession. Unwittingly, some of the previously identified sampling biases in our data collection methodologies turned out to be much more significant than we might have suspected. Simply put, young and highly educated members of generations "X" and "Y" were particularly vulnerable to the hallmarks of this recession: entry level job losses and vanishing home equity.
Reflecting back on 2010, we can offer a number of observations directly from our data:
► GDP growth rates can be significantly impacted by non-consumer line items. Manufacturers building inventory, export growth, increased governmental spending and (counter-intuitively) consumer cut-backs on imported goods have all increased the GDP during portions of 2010 even as "real final" consumer commerce remained relatively flat.
► This recession was not a shared experience. Some consumers were especially hard hit by the downturn, just as they may have been the very same demographics that benefited the most from the expansion that led up to the 2007 peak. Unfortunately, the consumers who provide the transactions that we capture appear to be disproportionately among those most severely impacted by this recession.
► At year-end 2010 consumers were still cautious about the long term. In effect, the massive stimulus applied by the government during 2010 still didn't significantly improve longer term consumer confidence. Households are still deleveraging, albeit at a moderated pace. Consumers are still reacting to their own personal (and highly localized) assessments of the employment and housing markets, and they currently see no reason to significantly change their new-found conservative behaviors.
► Recession-fatigued consumers can self-medicate with holiday spending while still adhering to long term outlooks. December consumer confidence surveys clearly indicate that consumers are not yet convinced that the "recovery" is real or sustainable. A corollary to that observation is that retail sales surveys can be a misleading indication of the quality of commerce.
We can also offer some other general economic observations more broadly hinted at in our data:
► Infrastructure spending by governments is poor way to stimulate the economy. Repaving roads is a great way to spend vast sums of money on asphalt and concrete. It is a less efficient way to create quality long term jobs, revitalize the housing market or (evidently) help the consumers we track.
► Corporate earnings can be a misleading indication of the health of national commerce. Major U.S. corporations are in a privileged position in the economic food chain, with access to overseas markets, commercial paper, cheap loans, ruthless human resources departments, governmental contracts and stimulus monies. The people actually creating new jobs don't have such access. This is the business corollary to the "not a shared experience" mentioned above -- and it directly impacts the vast majority of the on-line merchants that provide the flip side of the consumer transactions we track.
► In time the unemployed simply disappear. They transform into students, the underemployed, the "discouraged," the prematurely retired or the chronically starving self-employed. Compared to the 1930's however, a surviving second household income has often mitigated the human suffering -- even as upside-down mortgages have prevented the mobility necessary to pursue elusive jobs. Many of the households caught in those binds are part of the "tech-savvy" cohort of on-line shoppers that we have tracked since 2004.
► Rescuing banks does not stimulate the economy. Saving banks may be necessary to prevent economic Armageddon, but it is not sufficient (in and of itself) to ensure a self-sustaining recovery. When provided with enough taxpayer cash to be both liquid and solvent, banks will promptly act in their own self interest. And changing regulatory benchmarks and/or accounting rules only facilitates that behavior. Our data includes the impact of the housing sector on the economy, and rescuing the banks has clearly not revitalized that industry.
► Ben Bernanke can't force people to borrow money that they don't want. And as mentioned above, he also apparently can't force banks to lend money they would rather use for other purposes, especially if all the highly qualified borrowers don't need any more debt. Over the past three years the Fed has discovered the limits to what "policy" can do, and the quality shift in the transactions we track indicates that our consumers still have no interest in leveraging back up.
► By "feeling the economic pain" among their constituents, politicians have promised results they don't have the means to deliver. Blame this political empowerment on Keynes, although it has certainly created a nice gig for Alan Greenspan and his successors. The problem is that now the "policy" cupboard has gone bare. Fortunately, Lincoln was right: you can't fool all of the people all of the time. Deep down the public knows that politicians can't really fix things -- especially if gridlock is setting in. Unlike 2008, this year our data never did see a substantial uptick after the electoral "FUD" (Fear, Uncertainty and Doubt) was resolved. Our consumers seem to know that -- self medicated holiday cheer aside -- the macro picture isn't going to change anytime soon.
We are in the business of collecting data about on-line consumer transactions for discretionary durable goods. We're not going to change what we do (as some have suggested) when the GDP stops tracking our on-line consumers or when the housing market becomes irrelevant within the latest quarter of economic data. Our job will remain the publication of what we collect, however contrary that data may be. And right now that data is materially weaker that many people would like to believe.
http://www.consumerindexes.com/


Comment