 Tweet
Tweet
Foreclosure fatigue ... deficit fatigue ... fraud fatigue ... it's a national pandemic.
Getting lost in the numbers is an easy thing especially with the magnitude of numbers being tossed out by Wall Street and our government. I think many in the country have just become apathetic to �billions� or �trillions� of dollars being thrown around as if this was a common part of daily dialogue. When California had its first budget fiasco with the housing market imploding a few years back a few billion dollars captivated the attention of the state for months on end. Today, even the prospect of a $28 billion deficit hardly seems to garner any attention. At a certain point people want more bread and circuses even if nothing has really changed in the underlying fundamentals of the economy. 1 out of 5 mortgages in the US is either underwater, in foreclosure, or modified but not making any payments. In fact, today we have the largest number of distressed properties on the books. The only reason the numbers have fallen is because of the �dirty current� mortgages that are modified and are now temporarily in the performing bucket. Yet these default at 50 percent or higher rates so it is more can-kicking behavior. If we even do a cursory look of MLS foreclosures on a US map we realize that housing problems are still largely present.
Here is a map courtesy of Google showing active foreclosures:
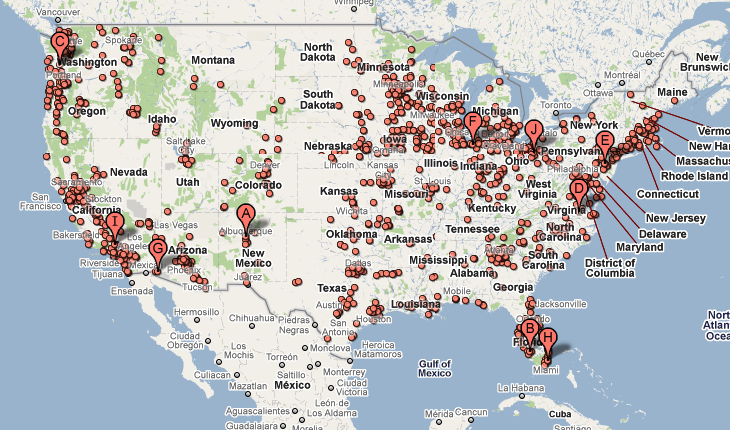
Google now offers this great feature that can overlay onto Google Maps and allows for the mapping of MLS active foreclosures. What are you looking at above? What you are seeing above is 5.2 million Americans living in homes that are now 60, 90+ delinquent, or bank owned.
The above is the equivalent of a MRI scan on the housing market. Nationwide things are as bad as they have ever been. So you have to ask where all those trillions of dollars that were supposed to help the housing market went?
http://www.doctorhousingbubble.com/w...eo-socal-maps/
Getting lost in the numbers is an easy thing especially with the magnitude of numbers being tossed out by Wall Street and our government. I think many in the country have just become apathetic to �billions� or �trillions� of dollars being thrown around as if this was a common part of daily dialogue. When California had its first budget fiasco with the housing market imploding a few years back a few billion dollars captivated the attention of the state for months on end. Today, even the prospect of a $28 billion deficit hardly seems to garner any attention. At a certain point people want more bread and circuses even if nothing has really changed in the underlying fundamentals of the economy. 1 out of 5 mortgages in the US is either underwater, in foreclosure, or modified but not making any payments. In fact, today we have the largest number of distressed properties on the books. The only reason the numbers have fallen is because of the �dirty current� mortgages that are modified and are now temporarily in the performing bucket. Yet these default at 50 percent or higher rates so it is more can-kicking behavior. If we even do a cursory look of MLS foreclosures on a US map we realize that housing problems are still largely present.
Here is a map courtesy of Google showing active foreclosures:
Google now offers this great feature that can overlay onto Google Maps and allows for the mapping of MLS active foreclosures. What are you looking at above? What you are seeing above is 5.2 million Americans living in homes that are now 60, 90+ delinquent, or bank owned.
The above is the equivalent of a MRI scan on the housing market. Nationwide things are as bad as they have ever been. So you have to ask where all those trillions of dollars that were supposed to help the housing market went?
http://www.doctorhousingbubble.com/w...eo-socal-maps/
 .
.  .
.


Comment