 Tweet
Tweet
The housing market is going to experience some serious pangs of withdrawal in 2011. With a mixed government we can rest assured that there will be more pressure on doing very little to stop the bleeding in the housing market. The banks will get their share as usual, but for the folks losing their homes and squatting I�m not sure if 2011 is going to be their year. To preserve the banking industry, the Federal Reserve has jumped into the abyss head first by announcing some $600 billion of money printing part two. They don�t call it money printing since they are basically giving banks incredible liquidity to gamble again in the stock market and stocks are responding with great joy. But what does that mean for the poor Joe and Jane on Main Street who have a $2,000 mortgage and have lost their income? Not much and that is why the foreclosure rate is still near peak levels and shows no signs of abatement. Given the current trends and political winds, it is likely that real estate prices will experience a 10 to 15 percent drop nationwide (certainly in California) by the end of 2011. Let us examine 7 charts carefully to see why this case is likely.
Chart #1 � Post-tax credit blues
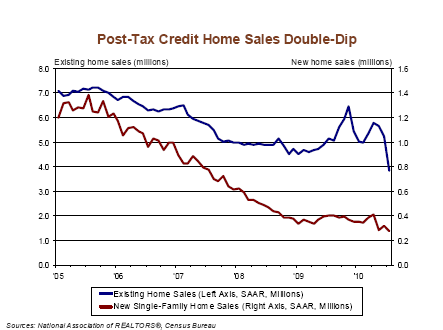
The tax credit euphoria is now over. Enough people were sitting on the fence perched like pigeons waiting for a crumb to hit the ground. When the tax credit was announced, this was enough to get people to buy. Yet this wasn�t based on sound economic fundamentals. This is like running into an AA meeting and announcing you have free liquor for anyone outside. Many will resist but some won�t. As the chart above clearly indicates, some took the bait and now the excitement has worn off. The toxic mortgage juice is gone but a free giveaway is always a method of churning up demand. Yet with the new Congress and anger at bailouts (surveys found that most Americans are largely mad at banks and Wall Street) do you envision more bailouts coming in the pipeline?
Chart #2 � Home prices still too high
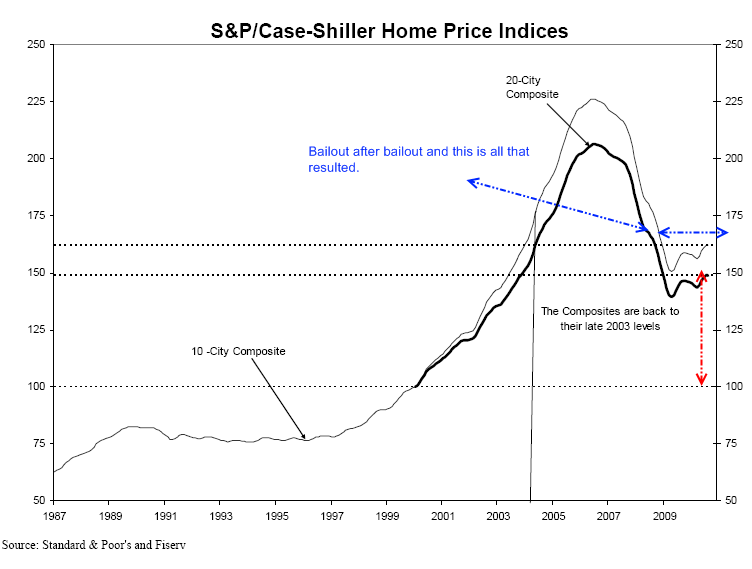
Adjusting for inflation and looking at the longer-term, home prices are still too high even on a nationwide basis. This is hard for many to believe because they are hypnotized by the fact that mortgage rates are in the 4 percent range. That is great but that is costing us over $2 trillion in Federal Reserve gimmicks that are putting the health of the U.S. dollar at risk. This isn�t some kind of hidden agenda. The Fed openly talks about this! They want to create inflation (aka deflate the dollar) and somehow inflate our economy out of debt by guess what, more debt! Japan has already tried this story and it didn�t exactly work as planned.
What people also forget about the above is that as home prices moved lower, so have incomes. This race to the bottom is not healthy. Long-term mortgage rates hover in the 8 to 9 percent range if we look at 40+ years of data. In other words, even reverting back to the mean would create a doubling of mortgage payments for future buyers. So who are you going to sell your home to in 5 to 7 years? Sure you can take on a 4.5 percent interest rate today but are you certain someone in 2017 can? Unless you plan on staying put for a decade, buying a home today is speculation. Just looking at the above, home prices have at least a 10 to 15 percent correction coming.
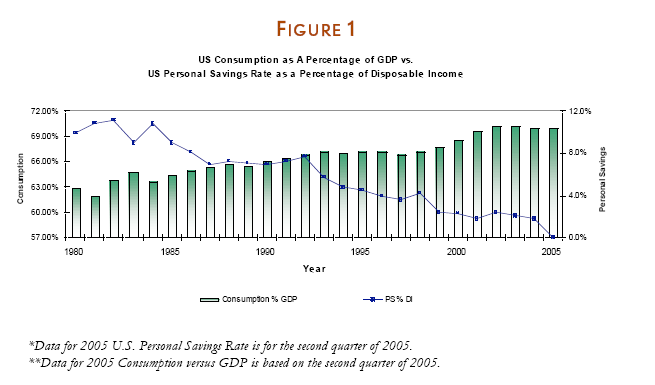
Chart #3 � Save less and spend more
Source: Lending Tree
The above chart pretty much encapsulates the last 30 years of our economy. Save less and spend more. It doesn�t take a rocket scientist or central banker to figure out that if you spend more than you earn, you will have problems. Now recently, the saving rate has trended up but this is because people fear the Wall Street casino and have put money back into savings accounts. Also, access to credit has been cut for millions of Americans so many actually have to save to buy things. This applies to virtually everyone except the politically connected banks who have the Fed that can magically print $600 billion for them. Where is your slice of that buy? The above model is unsustainable and those thinking we�ll be back to it just don�t look at what is currently happening in the market.
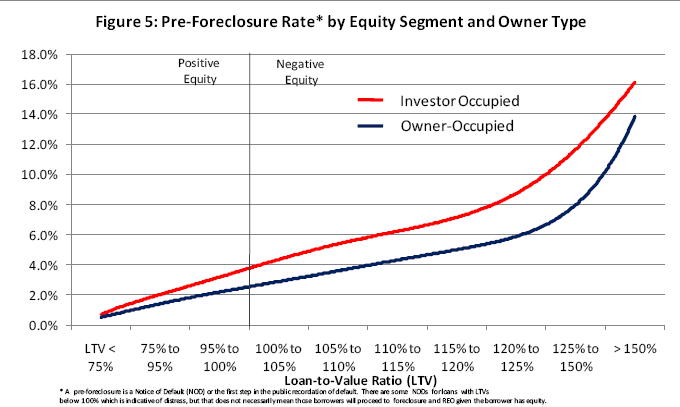
Chart #4 � Investors and homeowners underwater
Source: CoreLogic
This is an excellent chart because it highlights a misconception in the market. You would assume as an �investor� you would have a better sense of measuring a value of a home. Yet with the HGTV and home flipping trance, many thought that all it took to turn a $100,000 profit on a flip was some stucco and Ikea furniture. With easy financing, everyone with the desire to do this had the ability to go all out. The above chart shows that those investors are more underwater than regular homeowners in today�s market. The above chart is for the shadow inventory which shows us we have a pipeline of homes gearing up to come online. And guess what? Foreclosures sell for less. In other words, a 10 to 15 percent decline is very likely.
Chart #5 � With no juice delinquency has shot back up
For those who thought the market was standing on its own two feet the above chart says it all. Remove the tax-credit, HAMP, artificially low mortgage rates, and other short-term bandages and the problems reemerge. I know the real estate industry would like to bring tax credits back even though they are obviously an expensive waste of taxpayer money but that isn�t likely to happen. And even if it does somehow come back, all it will do is prolong the inevitable. Ultimately higher paying jobs is what will get the housing market back on its feet or maintain current home values. Did we hear any realistic plans about creating jobs from either of the parties this year? In fact, some argued we should rid ourselves of the minimum wage! That sure sounds like a wage growth strategy. Income growth is going in the opposite direction as wealth is being concentrated in fewer and fewer hands.
Income inequality is at its highest level since the Great Depression. This is a fact. How many vacant or underwater homes can a banking executive purchase? I doubt that they will be eating up the entire excess inventory in the market unless they find it in the Hamptons.
Chart #6 � Banks don�t trust you
This chart shows how banks feel about you. Banks are willing to doll out taxpayer backed mortgages in Fannie Mae, Freddie Mac, and FHA insured loans yet they will not touch their precious load of dough. Losses are raging in these three which now make up over 95 percent of the entire mortgage market. If these government backed loan mills relaxed standards and went option ARM like, you can bet on it that banks will flood the system with loans to anyone yet again. They don�t care about long-term sustainability. As the options of crap they can doll out limit and as the losses mount, there are fewer options to finance a home if you don�t have the income. And right now, many Americans are dealing with the worst economy in a generation. Until that changes, we can expect home prices to move lower.
Chart #7 � End of consumer debt?
We�ve reached peak debt. It is unlikely that we will be allowed to take out $50,000 in zero percent credit card debt, finance a BMW with zero percent for 7 years, and buy a $750,000 home on an option ARM all on an income of $100,000 in the next few years. Those days are over. The Fed ironically is trying to re-create that environment. But you can�t create an environment full of grift and embezzlement unless you want to deal with the ramifications. The housing bubble was a criminal enterprise. Forget all these theories and economic models trying to explain it away and dilute blame, the housing bubble needs to have some serious RICO investigations. It was a sophisticated and complicated money laundering operation.
The banks robbed the taxpayers and just look at the home prices above. The purpose is rather clear. Home prices will decline further in 2011 but the question is by how much. 10 to 15 percent seems to be a reasonable expectation given the headwinds we are facing with foreclosures, jobs, and the deleveraging of debt. Now that the too big to fail have sunk their fangs into the taxpayer wallet and are guaranteed not to fail, they�ll be more open to dumping homes on the market at fire sale prices.
http://www.doctorhousingbubble.com/7...using-in-2011/
Chart #1 � Post-tax credit blues
The tax credit euphoria is now over. Enough people were sitting on the fence perched like pigeons waiting for a crumb to hit the ground. When the tax credit was announced, this was enough to get people to buy. Yet this wasn�t based on sound economic fundamentals. This is like running into an AA meeting and announcing you have free liquor for anyone outside. Many will resist but some won�t. As the chart above clearly indicates, some took the bait and now the excitement has worn off. The toxic mortgage juice is gone but a free giveaway is always a method of churning up demand. Yet with the new Congress and anger at bailouts (surveys found that most Americans are largely mad at banks and Wall Street) do you envision more bailouts coming in the pipeline?
Chart #2 � Home prices still too high
Adjusting for inflation and looking at the longer-term, home prices are still too high even on a nationwide basis. This is hard for many to believe because they are hypnotized by the fact that mortgage rates are in the 4 percent range. That is great but that is costing us over $2 trillion in Federal Reserve gimmicks that are putting the health of the U.S. dollar at risk. This isn�t some kind of hidden agenda. The Fed openly talks about this! They want to create inflation (aka deflate the dollar) and somehow inflate our economy out of debt by guess what, more debt! Japan has already tried this story and it didn�t exactly work as planned.
What people also forget about the above is that as home prices moved lower, so have incomes. This race to the bottom is not healthy. Long-term mortgage rates hover in the 8 to 9 percent range if we look at 40+ years of data. In other words, even reverting back to the mean would create a doubling of mortgage payments for future buyers. So who are you going to sell your home to in 5 to 7 years? Sure you can take on a 4.5 percent interest rate today but are you certain someone in 2017 can? Unless you plan on staying put for a decade, buying a home today is speculation. Just looking at the above, home prices have at least a 10 to 15 percent correction coming.
Chart #3 � Save less and spend more
Source: Lending Tree
The above chart pretty much encapsulates the last 30 years of our economy. Save less and spend more. It doesn�t take a rocket scientist or central banker to figure out that if you spend more than you earn, you will have problems. Now recently, the saving rate has trended up but this is because people fear the Wall Street casino and have put money back into savings accounts. Also, access to credit has been cut for millions of Americans so many actually have to save to buy things. This applies to virtually everyone except the politically connected banks who have the Fed that can magically print $600 billion for them. Where is your slice of that buy? The above model is unsustainable and those thinking we�ll be back to it just don�t look at what is currently happening in the market.
Chart #4 � Investors and homeowners underwater
Source: CoreLogic
This is an excellent chart because it highlights a misconception in the market. You would assume as an �investor� you would have a better sense of measuring a value of a home. Yet with the HGTV and home flipping trance, many thought that all it took to turn a $100,000 profit on a flip was some stucco and Ikea furniture. With easy financing, everyone with the desire to do this had the ability to go all out. The above chart shows that those investors are more underwater than regular homeowners in today�s market. The above chart is for the shadow inventory which shows us we have a pipeline of homes gearing up to come online. And guess what? Foreclosures sell for less. In other words, a 10 to 15 percent decline is very likely.
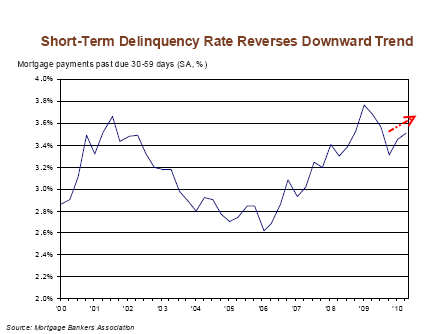
Chart #5 � With no juice delinquency has shot back up
For those who thought the market was standing on its own two feet the above chart says it all. Remove the tax-credit, HAMP, artificially low mortgage rates, and other short-term bandages and the problems reemerge. I know the real estate industry would like to bring tax credits back even though they are obviously an expensive waste of taxpayer money but that isn�t likely to happen. And even if it does somehow come back, all it will do is prolong the inevitable. Ultimately higher paying jobs is what will get the housing market back on its feet or maintain current home values. Did we hear any realistic plans about creating jobs from either of the parties this year? In fact, some argued we should rid ourselves of the minimum wage! That sure sounds like a wage growth strategy. Income growth is going in the opposite direction as wealth is being concentrated in fewer and fewer hands.
Income inequality is at its highest level since the Great Depression. This is a fact. How many vacant or underwater homes can a banking executive purchase? I doubt that they will be eating up the entire excess inventory in the market unless they find it in the Hamptons.
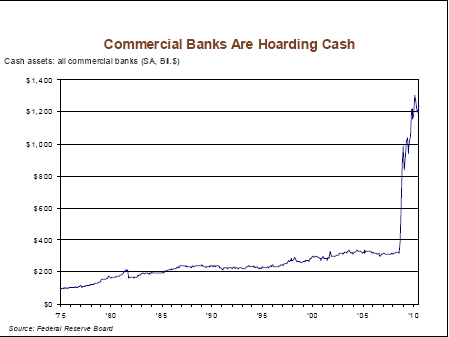
Chart #6 � Banks don�t trust you
This chart shows how banks feel about you. Banks are willing to doll out taxpayer backed mortgages in Fannie Mae, Freddie Mac, and FHA insured loans yet they will not touch their precious load of dough. Losses are raging in these three which now make up over 95 percent of the entire mortgage market. If these government backed loan mills relaxed standards and went option ARM like, you can bet on it that banks will flood the system with loans to anyone yet again. They don�t care about long-term sustainability. As the options of crap they can doll out limit and as the losses mount, there are fewer options to finance a home if you don�t have the income. And right now, many Americans are dealing with the worst economy in a generation. Until that changes, we can expect home prices to move lower.
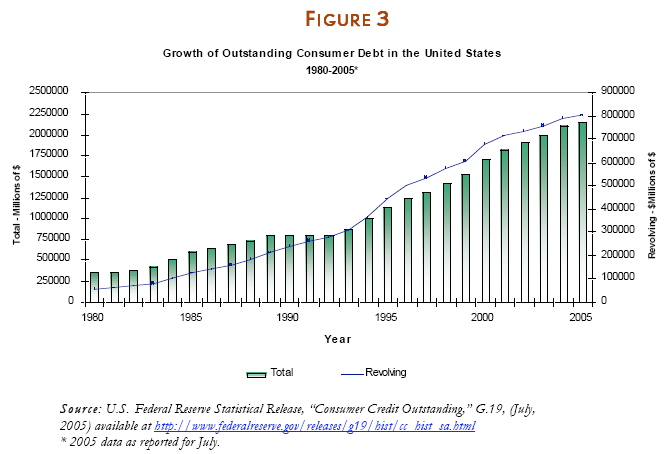
Chart #7 � End of consumer debt?
We�ve reached peak debt. It is unlikely that we will be allowed to take out $50,000 in zero percent credit card debt, finance a BMW with zero percent for 7 years, and buy a $750,000 home on an option ARM all on an income of $100,000 in the next few years. Those days are over. The Fed ironically is trying to re-create that environment. But you can�t create an environment full of grift and embezzlement unless you want to deal with the ramifications. The housing bubble was a criminal enterprise. Forget all these theories and economic models trying to explain it away and dilute blame, the housing bubble needs to have some serious RICO investigations. It was a sophisticated and complicated money laundering operation.
The banks robbed the taxpayers and just look at the home prices above. The purpose is rather clear. Home prices will decline further in 2011 but the question is by how much. 10 to 15 percent seems to be a reasonable expectation given the headwinds we are facing with foreclosures, jobs, and the deleveraging of debt. Now that the too big to fail have sunk their fangs into the taxpayer wallet and are guaranteed not to fail, they�ll be more open to dumping homes on the market at fire sale prices.
http://www.doctorhousingbubble.com/7...using-in-2011/
 , well after the initial real estate crash and the official end
  of the recession.
  I can do math though, and no amount of hopium can change that.... But, if we go on the premise of a poorer population due to globalization and the lack of labor pricing power (which helped during the 70's and could be a major difference between then and now; we were the major industrial power), aging population trying to retire and downgrade their homes, high interest rates and a previous bubble.... I have yet to see in history a bubble product inflate to previous peak within the 10-20 years of when it popped... I believe house prices will lag inflation.
 ) We stood on the sidelines, watching the bubble grow and our savings ZIRP away. Now I periodically line up the pro and cons on getting back into home ownership. I know you're a well-grounded 'tuliper. What's your list like?
Comment