 Tweet
Tweet
We all know this already, but nonetheless the numbers are still startling:
http://economicpopulist.org/content/...ing-age-adults
http://economicpopulist.org/content/...ing-age-adults
In the population of working age adults, the non employment rate is 26.9% (28,255,000 of 105,229,000). As a comparison to current levels, in 1998, the working age population growth was 80,662,000 and the non-employed in that population was 6,571,000 (8.15%).
This graph displays a Non-Employment rate of 26.9% among the working age population. Measuring employment growth to population growth since 1950, persons under age 16 and over age 64 are excluded from the BLS-CPS data-set(s) to make a determination of "working age population" and "working age employment".
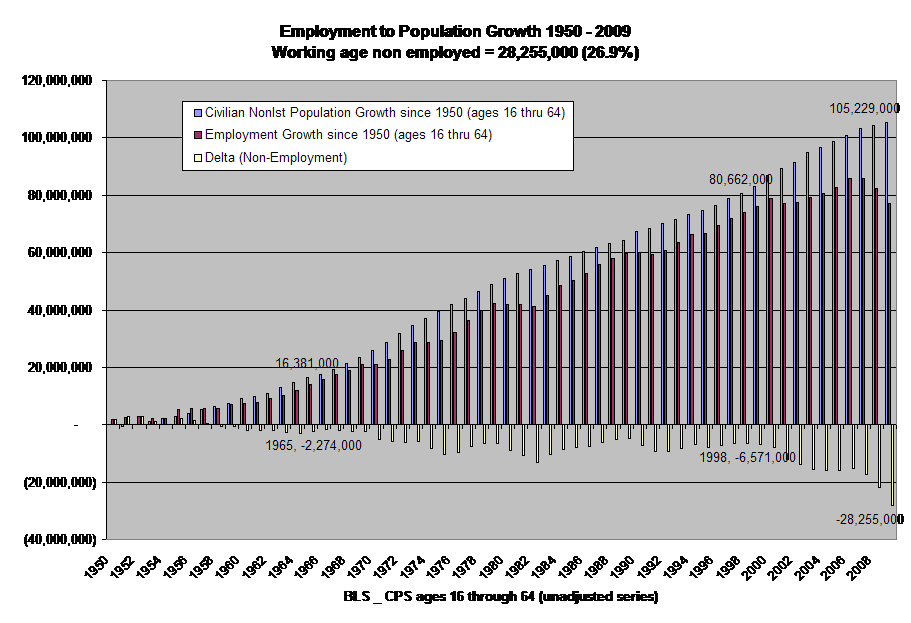
(Larger graph here)
The working age population and working age employment data-subsets are aggregated to produce growth statistic(s) starting from end of year levels in 1949.
The "Delta (Non-employment)" growth values are shown as negative for display purposes. This Delta is the difference between the working age population growth and working age employment growth. Of the 105,229,000 in the working age population, 28,255,000 were not working on Dec. 31, 2009. Keep in mind that the BLS-CPS definition of "Employed" is fairly liberal and includes self-employed and part-time workers.
As a comparison to current levels, in 1998, the working age population growth was 80,662,000 and the non-employed in that population was 6,571,000 (8.15%).
Since 1998, the working age population has increased by 24,567,000 (30.5%) while employment in the working age group increased by only 2,883,000 (3.9%).
This graph displays a Non-Employment rate of 26.9% among the working age population. Measuring employment growth to population growth since 1950, persons under age 16 and over age 64 are excluded from the BLS-CPS data-set(s) to make a determination of "working age population" and "working age employment".
(Larger graph here)
The working age population and working age employment data-subsets are aggregated to produce growth statistic(s) starting from end of year levels in 1949.
The "Delta (Non-employment)" growth values are shown as negative for display purposes. This Delta is the difference between the working age population growth and working age employment growth. Of the 105,229,000 in the working age population, 28,255,000 were not working on Dec. 31, 2009. Keep in mind that the BLS-CPS definition of "Employed" is fairly liberal and includes self-employed and part-time workers.
As a comparison to current levels, in 1998, the working age population growth was 80,662,000 and the non-employed in that population was 6,571,000 (8.15%).
Since 1998, the working age population has increased by 24,567,000 (30.5%) while employment in the working age group increased by only 2,883,000 (3.9%).