Announcement

Collapse
No announcement yet.

Inflation Peaks/Real-gdp Peaks/Interest Rates Peak

Collapse
X
 
  • Filter
  • Time
  • Show
Clear All
new posts

  • #91
    Re: Inflation Peaks/Real-gdp Peaks/Interest Rates Peak

    Originally posted by bart View Post
    Moi? A lead foot?! ;)


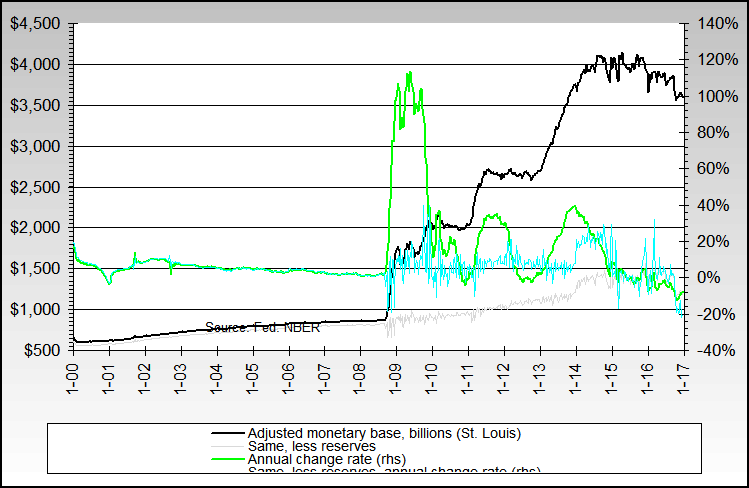
    And speaking of mercurial liquidity, interesting trend change in progress in the Fed's monetary base. It has turned up recently and broken a down trend in place since mid 2006 (the green and blue lines - read them on the right hand scale).


    In plain English, no worries about inflation moving up soon since the lag between increases and actual effects in the economy are at least 9 months on average. It also shows that the Fed is in there helping out on bank reserves.
    Monetary base is one of the few stats that is virtually 100% under the Fed's control.
    I got it, and good chart too.
    Jim 69 y/o

    "...Texans...the lowest form of white man there is." Robert Duvall, as Al Sieber, in "Geronimo." (see "Location" for examples.)

    Dedicated to the idea that all people deserve a chance for a healthy productive life. B&M Gates Fdn.

    Good judgement comes from experience; experience comes from bad judgement. Unknown.

    Comment


    • #92
      Re: Inflation Peaks/Real-gdp Peaks/Interest Rates Peak

      Originally posted by bart View Post
      Moi? A lead foot?! ;)


      And speaking of mercurial liquidity, interesting trend change in progress in the Fed's monetary base. It has turned up recently and broken a down trend in place since mid 2006 (the green and blue lines - read them on the right hand scale).

      ...

      In plain English, no worries about inflation moving up soon since the lag between increases and actual effects in the economy are at least 9 months on average. It also shows that the Fed is in there helping out on bank reserves.
      Monetary base is one of the few stats that is virtually 100% under the Fed's control.
      It depends of course on what you mean by inflation! Not to mention what constitutes "worries". ;) If you're referring to consumer prices, no question about it. But if stock prices resume their upward course, it will be pretty well baked in. If the Fed wants clear relief on the inflation front, it's going to have to countenance more stock price weakness. Stock prices are one of the first places price inflation shows up, and the same applies on the downside.

      How long before last Friday shows up in your monetary stats?
      Finster
      ...

      Comment


      • #93
        Re: Inflation Peaks/Real-gdp Peaks/Interest Rates Peak

        Originally posted by Finster View Post
        It depends of course on what you mean by inflation! Not to mention what constitutes "worries". ;) If you're referring to consumer prices, no question about it. But if stock prices resume their upward course, it will be pretty well baked in. If the Fed wants clear relief on the inflation front, it's going to have to countenance more stock price weakness. Stock prices are one of the first places price inflation shows up, and the same applies on the downside.

        How long before last Friday shows up in your monetary stats?
        Always the gadfly, Moriarity... ;)

        Both my CPI predictions and my CPI+lies predictions show a relative drop and support the disinflation/deflation concept... at least through early next year.

        Stocks can go up when inflation is headed down or level too, and not just from behind the scenes actions. They're not a reliable indicator.


        I'm not sure what charts you refer to nor what stats you're talking about from last Friday?
        As a very general rule, the data is at least one week old so that last Friday won't show up until week after this one.


        By the way, posting and answers from me (and even updates on my site) will probably be light or even non existent for a few days - external obligations and out of town guests.
        Last edited by bart; August 21, 2007, 03:36 PM.
        http://www.NowAndTheFuture.com

        Comment


        • #94
          Finn Time

          Originally posted by bart View Post
          Both my CPI predictions and my CPI+lies predictions show a relative drop and support the disinflation/deflation concept... at least through early next year.

          Stocks can go up when inflation is headed down or level too, and not just from behind the scenes actions. They're not a reliable indicator.
          Au contraire, they're the most reliable single price indicator there is. From the standpoint of most other inflation indicators, however, they are often out of sync because those others lag badly. It is erroneous to identify inflation with rising consumer prices, even correctly measured. And therefore to conclude that stock prices are not representative of inflation.

          No mere trivial point, either. Such error may be the most consequential in economics. The Greenspan Fed inflated like the dickens in 1995-2000, but misled itself and most of the rest of the world into thinking inflation was low because consumer prices remained quiescent. Meanwhile, financial asset prices were going off the charts. It has only been in the past few years that we see inflation showing up in the prices of goods and services as commodity prices tripled.

          We be able to set aside our inflation worries only if last week did not represent the bottom in stock prices.

          Originally posted by bart View Post
          I'm not sure what charts you refer to nor what stats you're talking about from last Friday?
          As a very general rule, the data is at least one week old so that last Friday won't show up until week after this one.
          :rolleyes: The stats represented in the chart in the post I was replying to! Context, O Mercurial Bartanius!!! :confused: :p :eek: The question is motivated by the very highly publicized Fed announcements of last Friday morning. When would any effects of that policy first be reflected in said chart? We take it that the answer is the week after this one.
          Finster
          ...

          Comment


          • #95
            Re: Inflation Peaks/Real-gdp Peaks/Interest Rates Peak

            Change in Minimum Fee Rate (haircut) for SOMA Securities Lending Program


            8/21/07

            Effective immediately, the Federal Reserve Bank of New York’s Open Market Trading Desk is making the following temporary change to the System Open Market Account ("SOMA") securities lending program:
            The minimum fee rate is decreased to 0.50 percent from 1.00 percent. All other program terms remain unchanged.

            "In finance, a "harcut" is a percentage that is subtracted from the market value of the assets that are being used as collateral. (Change in the Minimum Fee Rate for SOMA Securities Lending).

            The size of the "haircut" depends on the riskiness of the security offered as collateral. The size of the "haircut" reflects the perceived riskiness associated with the assets."
            Last edited by flow5; August 21, 2007, 04:29 PM.

            Comment


            • #96
              Re: Finn Time

              Originally posted by Finster View Post
              Au contraire, they're the most reliable single price indicator there is. From the standpoint of most other inflation indicators, however, they are often out of sync because those others lag badly. It is erroneous to identify inflation with rising consumer prices, even correctly measured. And therefore to conclude that stock prices are not representative of inflation.

              No mere trivial point, either. Such error may be the most consequential in economics. The Greenspan Fed inflated like the dickens in 1995-2000, but misled itself and most of the rest of the world into thinking inflation was low because consumer prices remained quiescent. Meanwhile, financial asset prices were going off the charts. It has only been in the past few years that we see inflation showing up in the prices of goods and services as commodity prices tripled.

              We be able to set aside our inflation worries only if last week did not represent the bottom in stock prices.

              What is the correlation, with and without the lags you note, between the FDI and the Wilshire (or whatever index you like)?
              It's pretty poor with the CPI or CPI+lies.

              The 1995-2000 Fed and inflation issues is the same as today - they don't see the CPI lies, not do they pay any attention to asset prices... and then compound the unsanity with the ridiculous core rate BS.


              Originally posted by Finster View Post
              :rolleyes: The stats represented in the chart in the post I was replying to! Context, O Mercurial Bartanius!!! :confused: :p :eek: The question is motivated by the very highly publicized Fed announcements of last Friday morning. When would any effects of that policy first be reflected in said chart? We take it that the answer is the week after this one.
              Specifics, my dear Finny, help keep this poor chart poisoned one from having to add more layers to his erstwhile hat...
              http://www.nowandfutures.com/grins/rimshot.mp3


              To answer your question though, the charts I publish on the 31st will show the first effects, if any.
              http://www.NowAndTheFuture.com

              Comment


              • #97
                Re: Inflation Peaks/Real-gdp Peaks/Interest Rates Peak

                Originally posted by flow5 View Post
                Change in Minimum Fee Rate (haircut) for SOMA Securities Lending Program

                8/21/07

                Effective immediately, the Federal Reserve Bank of New York’s Open Market Trading Desk is making the following temporary change to the System Open Market Account ("SOMA") securities lending program:
                The minimum fee rate is decreased to 0.50 percent from 1.00 percent. All other program terms remain unchanged.


                Securities Lending has been running at about double its average daily rate for over a month.

                The operations have averaged almost $6 billion per day. Today was just under $9 billion. The auctions have almost always been fully subscribed lately, and that's quite unusual.


                In plain English, the Fed is working very very hard to stabilize rates and provide liquidity where needed in the t-bond and t-bill markets... and in my opinion has been doing less than what the market wants (as proven by the auctions being fully subscribed - the average since 2002 is about 84%).
                http://www.NowAndTheFuture.com

                Comment


                • #98
                  Bartus Maximus

                  Originally posted by bart View Post
                  What is the correlation, with and without the lags you note, between the FDI and the Wilshire (or whatever index you like)?
                  It's pretty poor with the CPI or CPI+lies.
                  Oh, Bartus Maximus, it’s quite excellent. In 1949, after things had settled down post WWII, the US began a great monetary expansion. All through the 1950s and into the 1960s, consumer prices rose moderately, while stock prices went on a tear. As the 1960’s drew to a close, stock prices began to falter, while consumer price inflation began to accelerate. During the 1970s, stock prices made virtually no net progress while consumer price inflation caught up. During this period, the Fed reluctantly stepped up its inflation-fighting campaign, culminating with the famous Volcker squeeze, finally killing the inflationary cycle.

                  But within a few more years, the whole thing started again. Stock prices began to rise like a phoenix out of the late 1982 bottom, then crashed in 1987. Greenspan took the helm just before the crash, but maintained a good level of discipline into late 1994, around the time of the "Mexican peso crisis". Then reserve requirements were cut. About the same time, the Boskin Commission took a machete to the CPI. Stock prices went on a record-breaking five-year run. With a little help from Boskin et al, the CPI remained fairly well behaved, and commodity prices actually declined. Overall the 1980s and 1990s were a period of slower consumer price inflation, but wild financial asset price inflation. Greenspan himself crowed about the "productivity miracle". The next monetary push, however, barely restored financial asset prices to their 2000 peaks, while commodity prices went on a tear. The same overall pattern once again. Inflation was first evident in financial asset prices, and only later overflowed into consumer goods.

                  Both times, a period of rampant inflation in the prices of consumer goods was preceded by a period of rampant inflation in financial assets.

                  Originally posted by bart View Post
                  The 1995-2000 Fed and inflation issues is the same as today - they don't see the CPI lies, not do they pay any attention to asset prices... and then compound the unsanity with the ridiculous core rate BS.
                  Absolutely. And although the Bernanke Fed has done a pretty good job so far, he is a noted champion of the notion that asset prices don’t matter. Not to mention his tiresome references to "core" inflation.

                  Originally posted by bart View Post
                  Specifics, my dear Finny, help keep this poor chart poisoned one from having to add more layers to his erstwhile hat...
                  http://www.nowandfutures.com/grins/rimshot.mp3

                  To answer your question though, the charts I publish on the 31st will show the first effects, if any.
                  The discount window op itself has been reputed to be fairly small potatoes, but before we draw any conclusions as to the net effect of Fed ops of recent days, I want to see what your charts show.

                  We wait with baited breath …
                  Finster
                  ...

                  Comment


                  • #99
                    Re: Bartus Maximus

                    Originally posted by Finster View Post
                    Oh, Bartus Maximus, it’s quite excellent. In 1949, after things had settled down post WWII, the US began a great monetary expansion. All through the 1950s and into the 1960s, consumer prices rose moderately, while stock prices went on a tear. As the 1960’s drew to a close, stock prices began to falter, while consumer price inflation began to accelerate. During the 1970s, stock prices made virtually no net progress while consumer price inflation caught up. During this period, the Fed reluctantly stepped up its inflation-fighting campaign, culminating with the famous Volcker squeeze, finally killing the inflationary cycle.

                    But within a few more years, the whole thing started again. Stock prices began to rise like a phoenix out of the late 1982 bottom, then crashed in 1987. Greenspan took the helm just before the crash, but maintained a good level of discipline into late 1994, around the time of the "Mexican peso crisis". Then reserve requirements were cut. About the same time, the Boskin Commission took a machete to the CPI. Stock prices went on a record-breaking five-year run. With a little help from Boskin et al, the CPI remained fairly well behaved, and commodity prices actually declined. Overall the 1980s and 1990s were a period of slower consumer price inflation, but wild financial asset price inflation. Greenspan himself crowed about the "productivity miracle". The next monetary push, however, barely restored financial asset prices to their 2000 peaks, while commodity prices went on a tear. The same overall pattern once again. Inflation was first evident in financial asset prices, and only later overflowed into consumer goods.

                    Both times, a period of rampant inflation in the prices of consumer goods was preceded by a period of rampant inflation in financial assets.
                    Cool, and if we're looking at broad time frames like that, the CPI+lies also tracks pretty well - and with varying lags. Being more short term oriented than you, I tend to see things that way and thought you were talking about shorter term correlations.

                    As you know, the FDI and CPI+lies are at least in the same ball park on what they're trying to show and measure, although the FDI is broader and much more inclusive.


                    Originally posted by Finster View Post
                    The discount window op itself has been reputed to be fairly small potatoes, but before we draw any conclusions as to the net effect of Fed ops of recent days, I want to see what your charts show.

                    We wait with baited breath …

                    The discount rate drop is indeed a minor action in the scheme of things - it's nothing more than one of the first shots in the "battle".

                    By the way, a $5 billion 5 day TIO today...
                    http://www.NowAndTheFuture.com

                    Comment


                    • Re: Bartus Maximus

                      Originally posted by bart View Post
                      Cool, and if we're looking at broad time frames like that, the CPI+lies also tracks pretty well - and with varying lags.
                      The correlation between the probability of finding something with looking in the right place is also quite high … ;)

                      Originally posted by bart View Post
                      Being more short term oriented than you, I tend to see things that way and thought you were talking about shorter term correlations.
                      It has nothing to do with trading orientation. Stock prices lead consumer prices for everyone. :eek:

                      Originally posted by bart View Post
                      As you know, the FDI and CPI+lies are at least in the same ball park on what they're trying to show and measure, although the FDI is broader and much more inclusive.
                      Right … my comment about stock prices leading consumer prices, however, is not well exposed by the FDI, because the FDI doesn’t isolate any particular subset of prices. The relationship between stock prices and consumer prices is much better shown by comparing a broad stock index with a broad consumer prices index. The world stock indices published by MSCI and Dow Jones, for example, versus the SGS CPI.

                      Anyway, the point is that there is no way of sustainably elevating stock prices without also elevating consumer prices. The latter lag the former. And as we saw above, a sizable amount of that lag extends over many years. Hence the booming stock market of the 1960s foreshadowed booming consumer prices in the 1970s. And the booming stock market of the 1990s foreshadowed booming consumer prices in the 2000s.

                      Greenspan et al’s dismissal of the significance of rising asset prices really made a big mess. The Fed underwrote a monster stock price bubble in the 1990s under the erroneous pretext that inflation was low simply because consumer prices were behaving. Must be some kind of "productivity" thing, according to Greenspan.

                      But inflation wasn’t low. It was high. The only way we could have avoided rapid goods (including conspicuously energy) price increases in 2003-2007 would have been to allow stock prices to retrace virtually their entire bull market run. In other words, the inflation would have to be offset by the same amount of deflation. This is exactly what happened after inflation was allowed to get out of hand in the late 1920s. And the only reason the 1930s are not remembered the same way as the 1970s.

                      The discount rate drop is indeed a minor action in the scheme of things - it's nothing more than one of the first shots in the "battle".

                      Originally posted by bart View Post
                      By the way, a $5 billion 5 day TIO today...
                      Positive or negative? An addition to or subtraction from money/credit supply?
                      Finster
                      ...

                      Comment


                      • Re: Bartus Maximus

                        Originally posted by Finster View Post
                        The correlation between the probability of finding something with looking in the right place is also quite high … ;)
                        I need a sound byte of Valley girl going "fer shure, fer shure" ;)


                        Originally posted by Finster View Post
                        It has nothing to do with trading orientation. Stock prices lead consumer prices for everyone. :eek:
                        Truth oh manor maven... but the correlation isn't very good on the short term.


                        Originally posted by Finster View Post
                        Right … my comment about stock prices leading consumer prices, however, is not well exposed by the FDI, because the FDI doesn’t isolate any particular subset of prices. The relationship between stock prices and consumer prices is much better shown by comparing a broad stock index with a broad consumer prices index. The world stock indices published by MSCI and Dow Jones, for example, versus the SGS CPI.

                        Anyway, the point is that there is no way of sustainably elevating stock prices without also elevating consumer prices. The latter lag the former. And as we saw above, a sizable amount of that lag extends over many years. Hence the booming stock market of the 1960s foreshadowed booming consumer prices in the 1970s. And the booming stock market of the 1990s foreshadowed booming consumer prices in the 2000s.

                        Greenspan et al’s dismissal of the significance of rising asset prices really made a big mess. The Fed underwrote a monster stock price bubble in the 1990s under the erroneous pretext that inflation was low simply because consumer prices were behaving. Must be some kind of "productivity" thing, according to Greenspan.

                        But inflation wasn’t low. It was high. The only way we could have avoided rapid goods (including conspicuously energy) price increases in 2003-2007 would have been to allow stock prices to retrace virtually their entire bull market run. In other words, the inflation would have to be offset by the same amount of deflation. This is exactly what happened after inflation was allowed to get out of hand in the late 1920s. And the only reason the 1930s are not remembered the same way as the 1970s.

                        Thou speaketh sooth again on sustained increases in the stock markets, especially if the the stock indexes are inflation adjusted.

                        It's probably best that I don't comment on the productivity BS proselytized by Greenspan since it'd be extremely blue and not suitable for a public board.
                        It's a great example of how CBs and other scum use things like it to cover up their heinous money creation antics though.

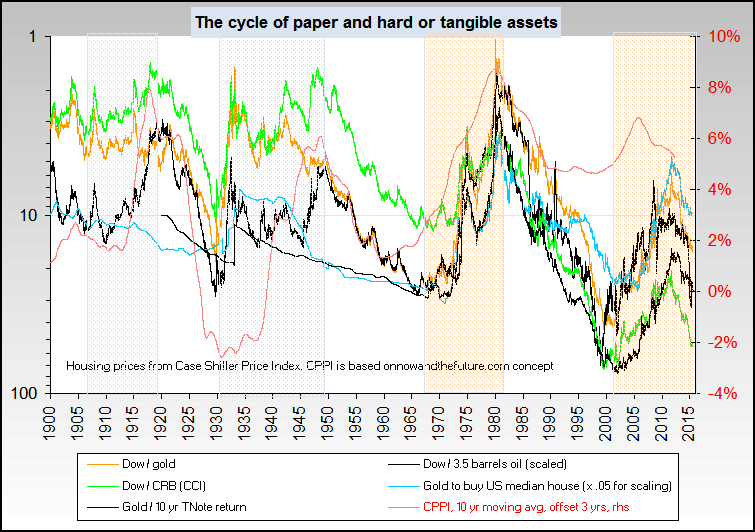
                        One last item on the different periods of time you bring up. For whatever reason(s), there is an actual cycle of them that runs roughly 17 years and that has been noted by many - including Jim Rogers and Marc Faber.
                        It's one of my primary long term helpful charts, and to a very significant degree answers the question "where will the money go when the Fed and other CBs fire up the printing presses?".


                        Originally posted by Finster View Post
                        Positive or negative? An addition to or subtraction from money/credit supply?
                        TIOs are always positive, and only an extremely short term add to the money supply... and defining money supply in very broad terms.
                        I liken them to a shot of methedrine to the stock and other markets.
                        http://www.NowAndTheFuture.com

                        Comment


                        • Re: Bartus Maximus

                          Originally posted by bart View Post
                          I need a sound byte of Valley girl going "fer shure, fer shure" ;)

                          Truth oh manor maven... but the correlation isn't very good on the short term.
                          It doesn’t have to be. Whatever the Fed does to bolster stock prices will ultimately show up in consumer prices. There’s no way around it.

                          Recall the original point. The Bernanke Fed has ostensibly been trying to rein in inflation. Meanwhile the stock market has been rising. When it hit this latest air pocket, we finally saw the first real evidence that the Fed’s anti-inflation policy was getting traction. If it turns out that’s all there is to it, and we’ve already seen the lows in stock prices and they resume their upward trek, then it will constitute clear evidence that yet more consumer price inflation lies ahead.

                          Originally posted by bart View Post
                          Thou speaketh sooth again on sustained increases in the stock markets, especially if the the stock indexes are inflation adjusted.
                          That doesn’t work. For you can’t adjust the stock indexes for inflation without first knowing what inflation is. The exercise itself depends on assuming asset prices themselves don’t reflect inflation, that inflation somehow is a separate phenomenon outside of the domain of asset prices. So the whole idea of adjusting stock prices for inflation gets very circular.

                          So you are stuck. The only way it works is to adopt the Greenspanian-Bernankian premise that you’ve already agreed was invalid. :eek:

                          Originally posted by bart View Post
                          TIOs are always positive, and only an extremely short term add to the money supply... and defining money supply in very broad terms.
                          I liken them to a shot of methedrine to the stock and other markets.
                          And which will ultimately filter into consumer prices. We will not be able to set aside our worries about inflation after all. :mad:

                          Originally posted by bart View Post
                          One last item on the different periods of time you bring up. For whatever reason(s), there is an actual cycle of them that runs roughly 17 years and that has been noted by many - including Jim Rogers and Marc Faber.
                          Rogers and Faber are wrong.

                          It’s 35 years. :p

                          ;)
                          Finster
                          ...

                          Comment


                          • Oh Oh

                            Oh oh.

                            Looks like the money pumping is revving up...

                            Citigroup, JPMorgan, Banks Borrow From Fed Window

                            (Update3)

                            By Joseph N. DiStefano

                            Aug. 22 (Bloomberg) -- The four largest U.S. banks each borrowed $500 million from the Federal Reserve to help ease a credit crunch that's threatening to slow economic growth and worsen the housing recession.

                            Citigroup Inc., Bank of America Corp., JPMorgan Chase & Co. and Wachovia Corp. said they used the Fed's so-called discount window five days after the central bank lowered the interest rate it charges banks and encouraged them to tap the resource.

                            All four companies have cheaper sources of money, and said they were borrowing from the Fed as an incentive for financial institutions that need the money more to follow suit. Hours after policy makers reduced the discount rate to 5.75 percent on Aug. 17, New York Fed President Timothy Geithner held a conference call with bank executives, asking them to use the window...

                            http://www.bloomberg.com/apps/news?p...d=aoxJbyIo3M3E
                            Finster
                            ...

                            Comment


                            • Re: Bartus Maximus

                              Originally posted by Finster View Post
                              It doesn’t have to be. Whatever the Fed does to bolster stock prices will ultimately show up in consumer prices. There’s no way around it.

                              Recall the original point. The Bernanke Fed has ostensibly been trying to rein in inflation. Meanwhile the stock market has been rising. When it hit this latest air pocket, we finally saw the first real evidence that the Fed’s anti-inflation policy was getting traction. If it turns out that’s all there is to it, and we’ve already seen the lows in stock prices and they resume their upward trek, then it will constitute clear evidence that yet more consumer price inflation lies ahead.

                              True again... but my point about the FDI or CPI+lies not working as a short term aid to predict the stock market direction is also true.


                              Originally posted by Finster View Post
                              That doesn’t work. For you can’t adjust the stock indexes for inflation without first knowing what inflation is. The exercise itself depends on assuming asset prices themselves don’t reflect inflation, that inflation somehow is a separate phenomenon outside of the domain of asset prices. So the whole idea of adjusting stock prices for inflation gets very circular.

                              So you are stuck. The only way it works is to adopt the Greenspanian-Bernankian premise that you’ve already agreed was invalid. :eek:

                              Oy... does it hurt when you cover your eye teeth with your tongue like that? ;)
                              Are you conceding that the FDI can't be used to adjust stock indexes for inflation with reasonable, albeit imperfect, accuracy? :eek: :eek: ;)


                              Originally posted by Finster View Post
                              And which will ultimately filter into consumer prices. We will not be able to set aside our worries about inflation after all. :mad:

                              Indeed... :mad: ... but TIOs have a *very* small effect on long term consumer prices. They're temporary, just like TOMOs.


                              Originally posted by Finster View Post
                              Rogers and Faber are wrong.

                              It’s 35 years. :p

                              ;)

                              Have you been taking eVangelism lessons without telling me? :eek: :rolleyes: ;)

                              The full cycle is around 35 years, the 1/2 cycle is around 17. :p
                              http://www.NowAndTheFuture.com

                              Comment


                              • Re: Oh Oh

                                Originally posted by Finster View Post
                                (Bloomberg) -- The four largest U.S. banks each borrowed $500 million from the Federal Reserve to help ease a credit crunch that's threatening to slow economic growth and worsen the housing recession.
                                .
                                .
                                .
                                All four companies have cheaper sources of money, and said they were borrowing from the Fed as an incentive for financial institutions that need the money more to follow suit.
                                I find that a little hard to believe.

                                Comment

                                Working...
                                X