 Tweet
Tweet
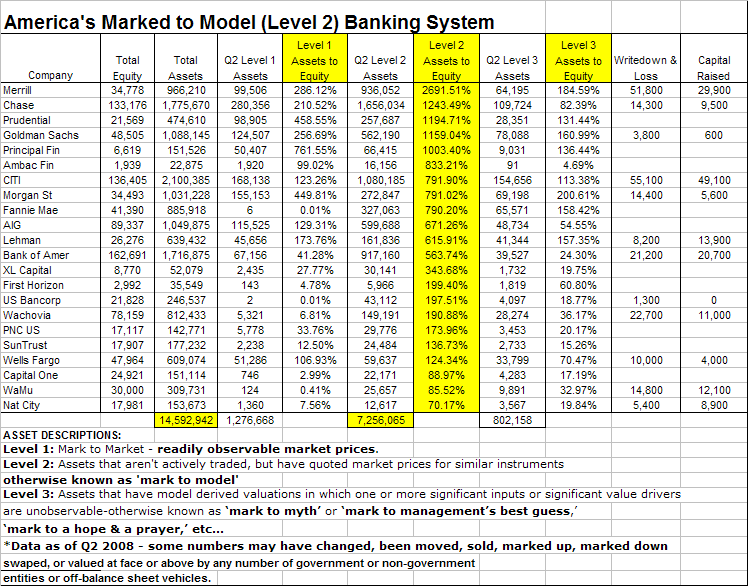
Re: "It Could Get Ugly Very Fast": Banking Crisis Grows, FDIC's Funds Shrink
The only prediction, other than iTulip, of a 1000 bank failures. That I've seen so far.
http://us1.institutionalriskanalytic...ry.asp?tag=378
Originally posted by metalman
View Post
http://us1.institutionalriskanalytic...ry.asp?tag=378
Comment