Announcement

Collapse
No announcement yet.

The $ is getting K I L L E D

Collapse
X
 
  • Filter
  • Time
  • Show
Clear All
new posts

  • #31
    Re: The $ is getting K I L L E D

    Originally posted by metalman View Post
    debt is not expanding... debt deflation... ever been a secular bull market in a time of debt deflation? can you give me an example, pls?
    I don't know if I will go that far as to call a secular bull where this have been the case, but I think the kind of situation that started in 1942, have certain similarities to today. That is: A large increase in government debt, to offset other forces. We don't yet know it private debt will go down relative to GDP as the economy recover from the recession, it could instead move higher (and give a situation more like the late seventies), but if it was to go lower, then I think high government spending would offset that, and even possibly result in market conditions similar to the 1939-1950 era, the trend that started in 1942, already then in transports, was partly due to the fed monetizing the debt needed to pay for the war, and the bull-market that followed in the 50-s-60-s, came because the fed took control over inflation in around 1949, and the private debt also had been deflated and was ready to once again expand. Those who bought stocks, in that whole era between 1937-1950 would had done quite well over the long run, and I think maybe something similar is at hand now.

    Just to specify. When I say deflationary secular bull, (I don't think of debt deflation, where you have lower private debt to gdp as a deflationary trend, as that can happen with commodity prices trending higher (and goverment debt to GDP trending higher), and inflation going higher, due that offsetting forces in government spending, thus making the trend inflationary, not deflationary, even if there is debt deflation). A deflationary trend is stable or falling commodity prices over a longer time period, and that can happen, or have happened typically as private debt to gdp expand, coupled with productivity gains, but still with commodity prices are stable or trending lower (after a longer inflationary trend have ended).

    The productivity gains that could be had now, would had been in the service sector as cost cutting, thus driving domestic prices lower, and lower imported prices from over-capacity in China, but I doubt it will happen to any significant extent due to exchange rate adjustments that will happen. I guess it will be high inflation on imported goods, and somewhat lower inflation on domestic goods and services as things recover. In general I think we still are in a trend, where money printing goes more directly into the CPI than before, ,because there is not so much productivity gains to be had, all of these effects are more or less already taken out. I think the free lunch era (of greenspan) when it was possible to pump the money supply like crazy, and still have low inflation is over.
    Last edited by nero3; August 01, 2009, 12:51 PM.

    Comment


    • #32
      Re: The $ is getting K I L L E D

      Originally posted by metalman View Post
      also, stocks do well in the early stages of inflation... the first year or so... then they fall back.
      That's where I think we are now, in the sense that companies might enjoy some cost cutting now, and then later some margins due to lower commodity prices while they stay down.

      After 2003, you had a boom for many stocks between 2003-2004, then they flattened out as the commodity bubble blew up and started to hurt profit margins. Typically Airline companies and Chip companies.

      I think we are in that 2003-2004 phase now.

      Comment


      • #33
        Re: The $ is getting K I L L E D

        Originally posted by c1ue View Post
        This is an interesting assertion.

        Do you have a link to some evidence of this or is this purely a personal opinion?

        I have been thinking about this to. With Japan, the Yen dropped, while yields dropped to, a lower currency did not increase yields then, So it's quite similar to Japan in the 90-s, if there is a dollar carry trade developing against emerging market's it makes sense. Simply and outflow of hot dollars in search of yield. That would give a blow off in emerging market's similar to the bubble in the NASDAQ and even traditional stocks from around 1995-2000.

        Anyway, if it is China, desperately trying to print yuan to buy treasury bonds to prop up the dollar, if that's the case it does not have to mean the dollar is about to crash. There was a dynamic like this in the seventies with the Yen and the dollar to, where the dollar dropped like a stone against the yen, every time the US economy had momentum in the seventies, especially after Jimmy Carter started to get the economy going in the late seventies, and inflation really shot to the moon.
        Last edited by nero3; August 01, 2009, 12:52 PM.

        Comment


        • #34
          Re: The $ is getting K I L L E D

          "if there is a dollar carry trade developing against emerging market's it makes sense. Simply and outflow of hot dollars in search of yield. "

          Reasonably, if the $USD were voting with their feet, then that should apply to US bonds also, and US yields should be pushed up - unless they were being controlled by the Fed?

          The whole world's money wants to go to China to be spent, 'cause that's where the fun is . . .
          Justice is the cornerstone of the world

          Comment


          • #35
            Re: The $ is getting K I L L E D

            Originally posted by cobben View Post
            "if there is a dollar carry trade developing against emerging market's it makes sense. Simply and outflow of hot dollars in search of yield. "

            Reasonably, if the $USD were voting with their feet, then that should apply to US bonds also, and US yields should be pushed up - unless they were being controlled by the Fed?

            The whole world's money wants to go to China to be spent, 'cause that's where the fun is . . .
            I don't have any graph for Japanese yields when the US bubble really got started in 95, but I would think that the yen weakened and that Japanese yields went down. It happened with US yields to in what I call the oil bubble after the credit crisis started, between mid 2007- june 2008, the bond market was smarter than oil traders During the period, US yields traded lower, and the dollar weakened from around 6,5 to 5 against the NOK, and of course gold rose. Even I agree, if we get an emerging market's bubble really pumping up now, then I'm pretty sure yields in the US will trend higher, with the dollar lower (unless fed increase the funds rate), or alternatively peg the 10 year notes and the long bond at a low level like during WW2 to finance the War. I am pretty sure the Congress will instruct the fed to do that, more than the 300 billion committed, if there suddenly is no funding from China. I don't think there is a political climate for raising rates.
            Last edited by nero3; August 01, 2009, 02:47 PM.

            Comment


            • #36
              Re: The $ is getting K I L L E D


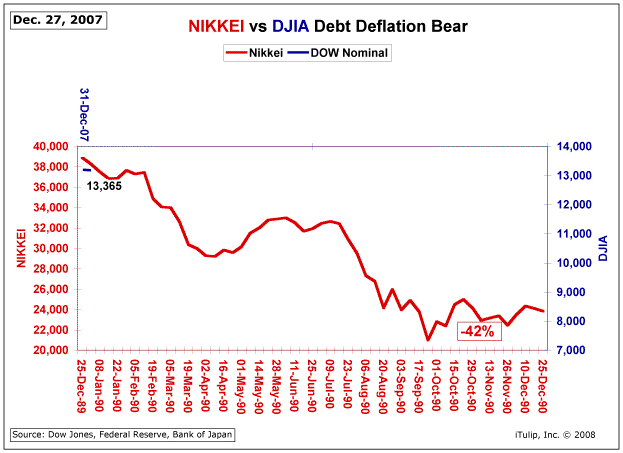
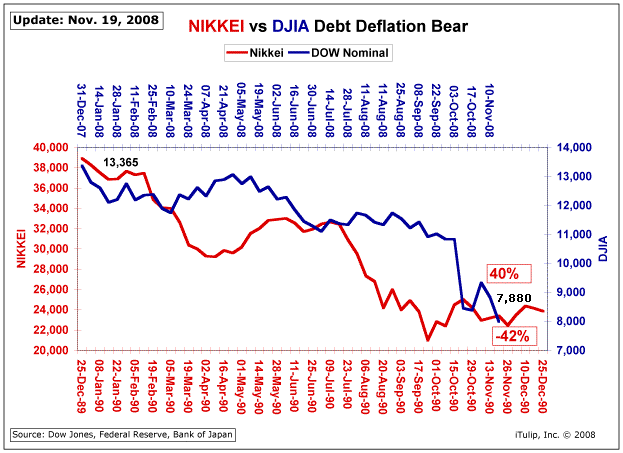
              I like this one. It's the only true graph, comparing the Dow and the Nikkei, without indulging in fantasies about how expensive the Dow is (like if the dow is as expensive as the nikkei back in the 90s


              Could the dow become as expensive as the nikkei was?
              I don't think so. I dont think it have the potential.

              But I do think Chinese shares show some promising signs. It's the only thing in the market's right now, that's a bubble for 100 % sure.

              I think Chinese chares are at a rather low level. They are much cheaper than shares in India. The bubble screaming is more about the level of the rise, not the pricing of individual companies.

              I think the Chinese market could be at a level as the Nikkei in around mid 1975.

              Comment


              • #37
                Re: The $ is getting K I L L E D

                Originally posted by nero3 View Post


                I like this one. It's the only true graph, comparing the Dow and the Nikkei, without indulging in fantasies about how expensive the Dow is (like if the dow is as expensive as the nikkei back in the 90s


                Could the dow become as expensive as the nikkei was?
                I don't think so. I dont think it have the potential.

                But I do think Chinese shares show some promising signs. It's the only thing in the market's right now, that's a bubble for 100 % sure.

                I think Chinese chares are at a rather low level. They are much cheaper than shares in India. The bubble screaming is more about the level of the rise, not the pricing of individual companies.

                I think the Chinese market could be at a level as the Nikkei in around mid 1975.

                Not quite, nero.

                The DOW in December 2007 was expensive as the Nikkei in 1990.

                Before.


                After. :mad:


                Lucky us. We knew beforehand.
                Last edited by Ann; August 02, 2009, 09:51 PM. Reason: Fixed the grammar.

                Comment


                • #38
                  Re: The $ is getting K I L L E D

                  The dollar hit support but did not break down from there. It's a double-bottom that I think will reverse for an uptrend. Intraday it may dip lower but I think the USD will close on or above support and start climbing for a bit. In the long run, it will most definitely break down into at least the 60's but not this time around.

                  Comment


                  • #39
                    Re: The $ is getting K I L L E D

                    Originally posted by Ann View Post
                    Not quite, nero.

                    The DOW in December 2007 was expensive as the Nikkei in 1990.

                    Before.


                    After. :mad:


                    Lucky us. We knew beforehand.
                    I don't like those graphs, it's more about luck than skill, because they hint's towards that the dow will track the nikkei as it went from 89 to the 2003 low, and that this just is the first bounce on what could be a long way down, but that is just nonsense. The Dow won't. It's much more likely that the dow have seen a multi decade low in nominal terms, however, don't worry, that will get worked into the script.

                    Comment


                    • #40
                      Re: The $ is getting K I L L E D

                      Nero,

                      You are again indulging in bull market era graphs.

                      The US bull market started in 1981, and ended roughly 2007.

                      To think that a mere 2 years is enough to reignite another 25 year bull market is quite simply foolish.

                      Just look at the performance of the markets in the 1964 to 1981 era.

                      So your optimism is nice, but a waste of energy on me unless you can show something more convincing than the short term evidence you have posited continuously thus far.

                      Comment


                      • #41
                        Re: The $ is getting K I L L E D

                        Originally posted by c1ue View Post
                        Nero,

                        You are again indulging in bull market era graphs.

                        The US bull market started in 1981, and ended roughly 2007.

                        To think that a mere 2 years is enough to reignite another 25 year bull market is quite simply foolish.

                        Just look at the performance of the markets in the 1964 to 1981 era.

                        So your optimism is nice, but a waste of energy on me unless you can show something more convincing than the short term evidence you have posited continuously thus far.

                        China's stock market has a market cap of only $2 trillion. Throw in $500 billion as they had done, and you don't need to be a genius to guess what's going to happen next, even in the midst of depression (which I believe China's real economy is in right now, regardless of what the official reports are).

                        Comment


                        • #42
                          Re: The $ is getting K I L L E D

                          Originally posted by touchring View Post
                          China's stock market has a market cap of only $2 trillion. Throw in $500 billion as they had done, and you don't need to be a genius to guess what's going to happen next, even in the midst of depression (which I believe China's real economy is in right now, regardless of what the official reports are).
                          The thing is it...I don't trust Faber on this.

                          China got a one way ticket. Spend like drunken sailors. Pump the money supply like crazy like they have done. Attract foreign money to stabilize the currency, as is happening, and then watch commodity prices rise, and create a negative real rates environment in the rest of the world, simply because China wakes up. It's this negative real rate environment, that is China's gift, to the rest of the world (that is what the west need).

                          As some other poster mention, I am not talking about a secular bull-market for the dow jones. However a secular bull for China is very possible. I am talking about a cyclical recovery, but I don't think the dow will see any nominal low that is lower than 666 on the S& P 500, ever, in history.
                          Last edited by nero3; August 03, 2009, 10:00 AM.

                          Comment


                          • #43
                            Re: The $ is getting K I L L E D

                            Originally posted by nero3 View Post
                            I don't like those graphs, it's more about luck than skill, because they hint's towards that the dow will track the nikkei as it went from 89 to the 2003 low, and that this just is the first bounce on what could be a long way down, but that is just nonsense. The Dow won't. It's much more likely that the dow have seen a multi decade low in nominal terms, however, don't worry, that will get worked into the script.
                            I like Nero's graph better too. It makes sense to compare the nominal value of the Nikkei to the Nominal value of the Dow. I.e., the Nikkei was at 35,000, which is greater than the Dow which was at 13,000.

                            It's simple people, really. 35,000 > 13,000, therefore the Nikkei was around 3 times more overvalued than the Dow. Q.E.D. Why bother taking P/E or any of those other valuation metrics into account. Clearly, if a pretty graph looks like another pretty graph there must be something there. Rock solid analysis again Nero, as usual.

                            I will extrapolate Nero's analysis: the Yen is currently 100 times overvalued compared to the dollar because 1 Dollar will get you 100 Yen. :rolleyes:

                            Comment


                            • #44
                              Re: The $ is getting K I L L E D

                              Originally posted by Munger View Post
                              I like Nero's graph better too. It makes sense to compare the nominal value of the Nikkei to the Nominal value of the Dow. I.e., the Nikkei was at 35,000, which is greater than the Dow at 13,000. It's simple, really. 35,000 > 13,000. Why take P/E or any of those other metrics into account. Clearly, if a pretty graph looks like another pretty graph there must be something there. Rock solid analysis again Nero, as usual.

                              I will extrapolate Nero's analysis: the Yen is 100 currently times overvalued compared to the dollar because 1 Dollar will get you 100 Yen. :rolleyes:
                              nero...

                              the first graph shows the nikkei in red... on the left hand side in nominal value ~ 38,000 ... on dec 25, 1989 just before the debt deflation hit... compared to the dow in blue... on the right in nominal value... dec 27, 2007 @ 13,365 before the debt deflation hit the dow.

                              ej's theory... similar process, similar stage, similar outcome... off ~ 40% over the next 12 mo... 1st year of the debt deflation bear market...


                              1 yr later? tracks not the same... usa is not japan... but similar... both have 1st yr of debt deflation in common.


                              get it?

                              lucky? these guys didn't thnk so...

                              Only analysts were included who:
                              1. provide some account on how they arrived at their conclusions.
                              2. went beyond predicting a real estate crisis, also making the link to real-sector recessionary implications, including an analytical account of those links.
                              3. the actual prediction must have been made by the analyst and available in the public domain, rather than being asserted by others.
                              4. the prediction had to have some timing attached to it.”

                              next... how about the second year?

                              the thesis is a bounce on fiscal stimulus... similar to the nikkei but not the same.

                              in yr 2, take into account the gov't reaction to debt deflation... and the market's reaction to the gov't reaction... zero rates and deficit spending.


                              lucky? yes, yes. whatever you say.

                              but... 'end of first bounce' called too early.

                              Comment


                              • #45
                                Re: The $ is getting K I L L E D

                                Originally posted by Munger View Post
                                I like Nero's graph better too. It makes sense to compare the nominal value of the Nikkei to the Nominal value of the Dow. I.e., the Nikkei was at 35,000, which is greater than the Dow which was at 13,000.

                                It's simple people, really. 35,000 > 13,000, therefore the Nikkei was around 3 times more overvalued than the Dow. Q.E.D. Why bother taking P/E or any of those other valuation metrics into account. Clearly, if a pretty graph looks like another pretty graph there must be something there. Rock solid analysis again Nero, as usual.

                                I will extrapolate Nero's analysis: the Yen is currently 100 times overvalued compared to the dollar because 1 Dollar will get you 100 Yen. :rolleyes:
                                You cheap shot.The point is that if you go back to the 1960-s, you will understand that the nikkei became inversely to US government bonds, just as the Dow got cheaper and cheaper through the seventies, the nikkei got more and more expensive, just as chinese shares are behaving as an inflation hedge now, and in 82, they was two separate worlds. The bear market in US government bonds, that was the driver of the nikkei tanked to, as inflation peaked and gave the nikkei a blow off phase, lasting to late 89. It's when you start way back, that my graph makes sense. In around 1965 the Nikkei was around 1,3 times the dow , the nikkei went on to around 8 times the level of the Dow in 82 , to more than 10 times, when the bubble peaked.

                                Comment

                                Working...
                                X