 Tweet
Tweet
Graphic as in a graph, and also as in the sense a picture of a car crash is graphic.
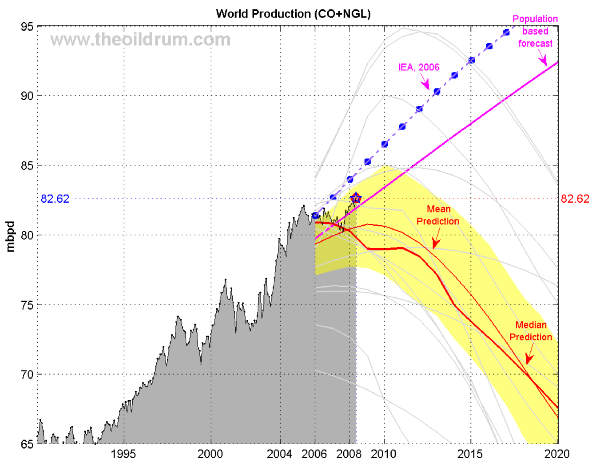
World oil production (EIA Monthly) for crude oil + NGL. The median forecast is calculated from 14 models that are predicting a peak before 2020 (Bakhtiari, Smith, Staniford, Loglets, Shock model, GBM, ASPO-[70,58,45], Robelius Low/High, HSM). 95% of the predictions sees a production peak between 2008 and 2010 at 77.5 - 85.0 mbpd (The 95% forecast variability area in yellow is computed using a bootstrap technique).)
Stolen from theoildrum (click piccy for link).
Note the brow of the latest hill is 2012.
Comment