Announcement

Collapse
No announcement yet.

True deflation: Is it a possibility worth worrying about?

Collapse
X
 
  • Filter
  • Time
  • Show
Clear All
new posts

  • True deflation: Is it a possibility worth worrying about?

    Just to be clear: my definition of "true deflation" is a prolonged dip of growth in the money supply by various measures below zero (money supply contraction in other words.)

    Any government except one run by a king-for-life is going to be concerned about the effects of deflation, so concerned that it will stop deflation no matter what cost, pretty much.

    That's because the monied classes build their wealth with debt. And the government itself is usually the biggest debtor. So there is nothing but incentives to inflate and nothing but disincentives to deflate.

    And indeed, it seems to me that the last deflation that we encountered was 1929-1933. As soon as the US got off the domestic gold standard, deflation ended.

    Even in Japan, there hasn't been true deflation 1990 to the present. Only a little dip in the money supply below zero, not long enough to really qualify as a true deflation.

    The arguments that the deflationists make is that you can't make people borrow money, and it is through borrowing that the money supply grows.

    But it is also true that there are many fiscal and political means to preventing a contraction of the money supply even if people aren't borrowing. Again I would point out Japan's experience.

    For these reasons, my belief is that true deflation won't happen until there is complete and utter collapse of the current money system. Therefore, true deflation is not worth seriously considering as an investor.

    Yes, there may be "disinflation". There probably will be, a la ka-POOM, but there will not be deflation. We can continue banking on inflation when we make our investments.

  • #2
    Re: True deflation: Is it a possibility worth worrying about?

    Originally posted by grapejelly

    Just to be clear: my definition of "true deflation" is a prolonged dip of growth in the money supply by various measures below zero (money supply contraction in other words.)
    Grapejelly,

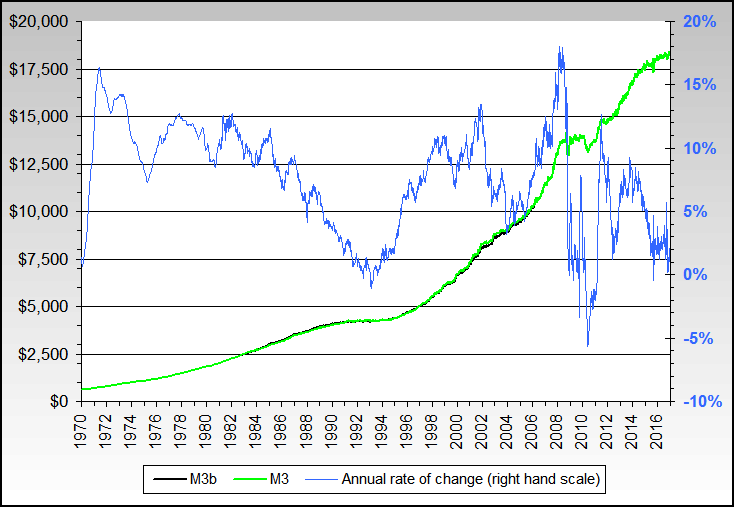
    I am currently working on this. Take a look at this chart:


    The data is here: http://research.stlouisfed.org/fred2/data/M3.txt

    By the look of it from the data, M3 grew by about 6.79% yoy from 1981 to 2006. Use this handy calc to do the math yourself.

    http://library.thinkquest.org/11771/.../growdeca.html

    This means that to keep growing it at the present rate, the M3 must increase $749.29, 800.16, 854.48, 912.49 Billion bonars for the present and subsequent four years.

    Now, you tell me, who is going to keep on borrowing that amount without adequate cash flow to service the debt?!

    I see a major war continuing to divert the eyes of the public, lest they become aware they have become homeless like Jefferson predicted.

    -Sapiens

    Comment


    • #3
      Re: True deflation: Is it a possibility worth worrying about?

      Originally posted by sapiens
      Now, you tell me, who is going to keep on borrowing that amount without adequate cash flow to service the debt?!
      the federal government

      Comment


      • #4
        Re: True deflation: Is it a possibility worth worrying about?

        Originally posted by jk
        the federal government
        You win the grand prize, JK!
        Finster
        ...

        Comment


        • #5
          Re: True deflation: Is it a possibility worth worrying about?

          Originally posted by Sapiens
          Grapejelly,

          I am currently working on this. Take a look at this chart:

          ...
          Don't forget you don't have to settle for "discontinued" in M3 any more ... http://www.nowandfutures.com/key_stats.html ...

          Finster
          ...

          Comment


          • #6
            Re: True deflation: Is it a possibility worth worrying about?

            Originally posted by Finster
            Don't forget you don't have to settle for "discontinued" in M3 any more ... http://www.nowandfutures.com/key_stats.html ...

            Thanks Finster!

            Comment


            • #7
              Comment Bart?

              Originally posted by Sapiens
              Thanks Finster!
              You're welcome ... thanks to Bart for the content!

              BTW, Bart, what does this imply for inflation going forward? Do you have a shorter term version of this chart, say, four or five years or so?
              Finster
              ...

              Comment


              • #8
                Re: Comment Bart?

                Originally posted by Finster
                You're welcome ... thanks to Bart for the content!

                BTW, Bart, what does this imply for inflation going forward? Do you have a shorter term version of this chart, say, four or five years or so?

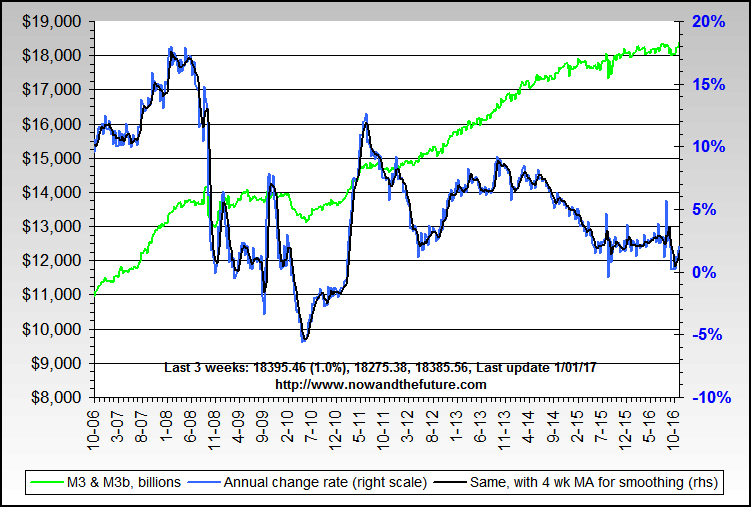
                It just so happens that I can oblige you on that.
                I even added an element lately to show the annual change rate for the most recent week (10.9%).


                The raw data, including data sources, is also available in an [IMG]Excel[/IMG] file or inside a [IMG]zip[/IMG] file. It's always out of date between 1-15 weeks but may be useful for some.

                By the way too, my chart and John Williams chart have diverged a bit lately and are now coming back together. I think that's due to a different way we estimate Eurodollars. Mine has an additional lagged relationship to oil prices... for what its worth.


                As far as what it implies for future inflation, I don't use it alone but rather use it inside the algorithms behind my inflation and CPI predictions.


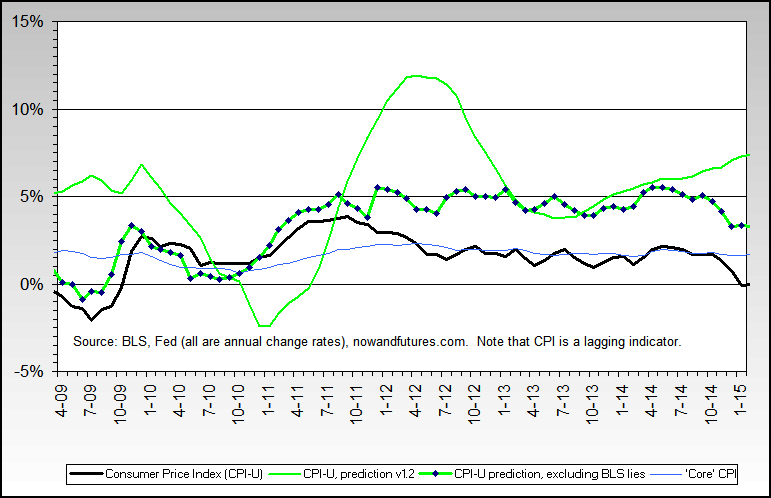
                This chart is excessively busy and needs work (duh) but the solid green line is my CPI prediction and the two lines with monthly tics in them are what I believe to be "real" CPI (the green one) and the burgundy one is another algorithm for the same thing that I've been testing.

                The household net worth rate of change as well as the BS core CPI are just shown for reference.
                Last edited by bart; February 20, 2007, 04:19 PM.
                http://www.NowAndTheFuture.com

                Comment


                • #9
                  Re: Comment Bart?

                  Originally posted by bart
                  It just so happens that I can oblige you on that.
                  I even added an element lately to show the annual change rate for the most recent week (10.9%).

                  [chart]

                  The raw data, including data sources, is also available in an [IMG]Excel[/IMG] file or inside a [IMG]zip[/IMG] file. It's always out of date between 1-15 weeks but may be useful for some.

                  By the way too, my chart and John Williams chart have diverged a bit lately and are now coming back together. I think that's due to a different way we estimate Eurodollars. Mine has an additional lagged relationship to oil prices... for what its worth.

                  As far as what it implies for future inflation, I don't use it alone but rather use it inside the algorithms behind my inflation and CPI predictions.

                  [chart]

                  This chart is excessively busy and needs work (duh) but the solid green line is my CPI prediction and the two lines with monthly tics in them are what I believe to be "real" CPI (the green one) and the burgundy one is another algorithm for the same thing that I've been testing.

                  The household net worth rate of change as well as the BS core CPI are just shown for reference.
                  Bless you, Bart! Wouldn't you say a 10.9% annual rate of increase is .... uhm ... fairly inflationary?:eek:
                  Finster
                  ...

                  Comment


                  • #10
                    Re: Comment Bart?

                    Originally posted by Finster
                    Bless you, Bart! Wouldn't you say a 10.9% annual rate of increase is .... uhm ... fairly inflationary?:eek:
                    And blessings to thou as well - nothing like a good tongue in cheek Fin moment in the morning.

                    Seriously though, it's only sort of inflationary since it's only one element of "money" or "money supply" and also needs to be evaluated by its relationship to things like GDP and inflation. China's M3 (actually M2 + CDs, the closest available) is running about 15-18% lately and GDP 10-15%.

                    Then we have both the credit and gov't debt games, and taken together, they're over 3 times the M3 total.

                    For additional perspective, U.S. M3 annual growth rate moved from about 7% to about 15% between late 1999 and late 2001... and we know what happened in 2001-2.
                    http://www.NowAndTheFuture.com

                    Comment


                    • #11
                      Re: Comment Bart?

                      Originally posted by bart
                      And blessings to thou as well - nothing like a good tongue in cheek Fin moment in the morning.

                      Seriously though, it's only sort of inflationary since it's only one element of "money" or "money supply" and also needs to be evaluated by its relationship to things like GDP and inflation. China's M3 (actually M2 + CDs, the closest available) is running about 15-18% lately and GDP 10-15%.

                      Then we have both the credit and gov't debt games, and taken together, they're over 3 times the M3 total.

                      For additional perspective, U.S. M3 annual growth rate moved from about 7% to about 15% between late 1999 and late 2001... and we know what happened in 2001-2.
                      Hmmm ... this prompts some additional questions ...

                      1) If M3 is only one element of money and money supply, what else do we need to figure in? Is there another, broader measure that we can look to?

                      2) Do we have another statistic that takes into account the "credit and gov't debt games, and taken together, they're over 3 times the M3 total"?

                      3) If M3 grew "from about 7% to about 15% between late 1999 and late 2001", then can we account for "what happened in 2001-2" with any other money/credit data you're aware of?
                      Finster
                      ...

                      Comment


                      • #12
                        Re: Comment Bart?

                        Originally posted by Finster
                        Hmmm ... this prompts some additional questions ...

                        1) If M3 is only one element of money and money supply, what else do we need to figure in? Is there another, broader measure that we can look to?

                        2) Do we have another statistic that takes into account the "credit and gov't debt games, and taken together, they're over 3 times the M3 total"?
                        I'll take "money and money supply definition madness" for $100, Alex... ;)

                        Those two questions are related so I'll take them together. In econ stats arcana, there used to be something called the "L" money series from the Fed.. but that was discontinued some decades ago, much like M3 was recently.

                        But the real kicker is actually defining money and then moving from there into classifying what is and what isn't money... and bypassing as much BS and needless and invented complexity as possible. That's the subject of a long article that will appear from me later this year (if someone else doesn't do it first ;)), and is also both incomplete on a research basis and pretty far down my list of things to do.

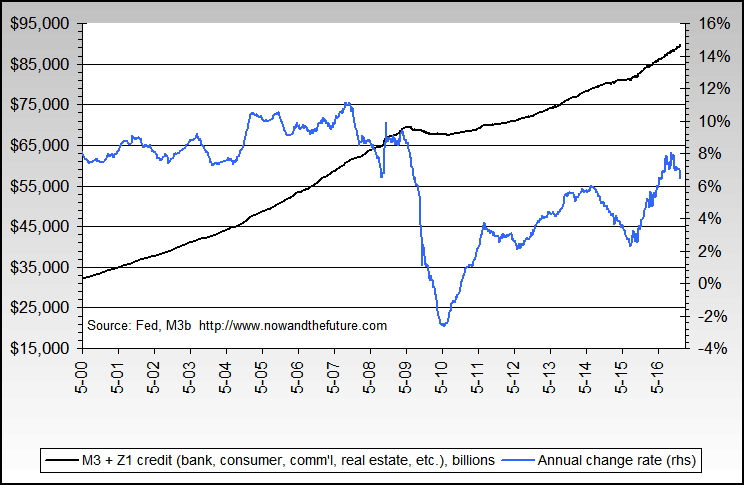
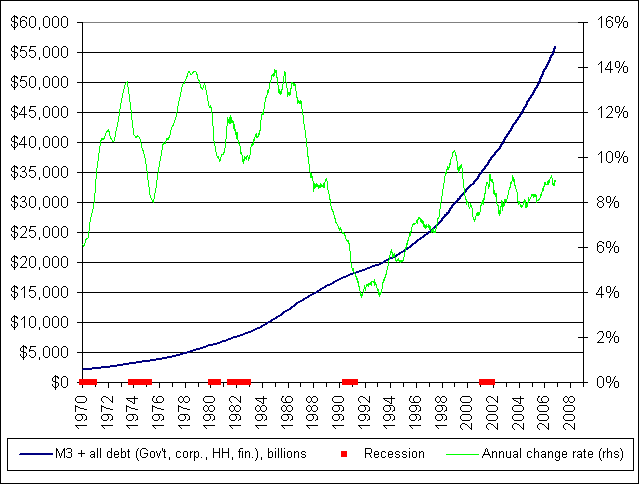
                        But on a here & now basis, here's a number of pictures of M3 with credit and debt (two faces of the same coin for purposes of this post).

                        M3 plus credit.
                        The first chart is short term and second is long term:


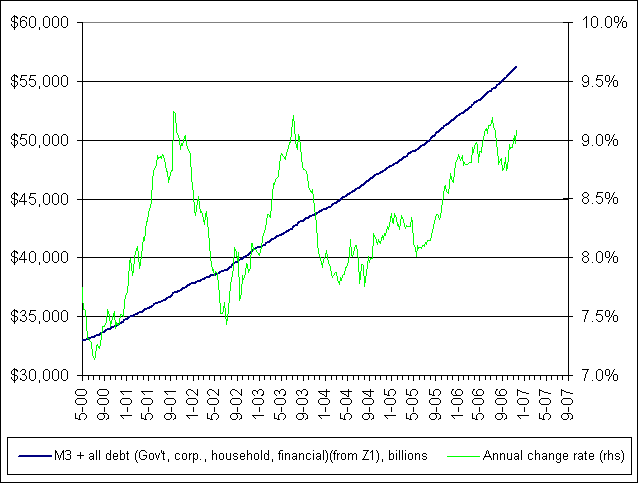
                        M3 plus all credit and debt.
                        Same, plus adding in all levels of gov't debt (excludes Medicare & SS liabilities) and corporate and financial credit / debt.
                        Again, the first chart is short term and second is long term:


                        M3 is about $11.5 trillion now, and as you can see, total credit plus debt is closer to 4x M3 than 3x... sometimes I can actually be conservative... ;)


                        There are many other thoughts and stats that I could show or talk about but I don't want to get much further into it since it flies in the face of most of the views from folk in dismal science (economics) land and I don't want to debate or defend it now.


                        Originally posted by Finster
                        3) If M3 grew "from about 7% to about 15% between late 1999 and late 2001", then can we account for "what happened in 2001-2" with any other money/credit data you're aware of?
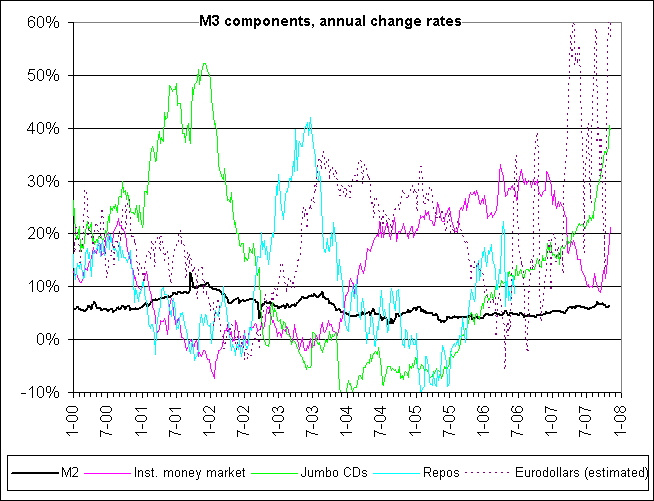
                        This one might get complex, partially because I'm not sure what you're asking... but to start with, the largest portion of that growth rate of M3 in 1999-2001 was due to huge growth in jumbo CDs probably as smart folk cashed out of the market. The growth of M3 today is only partially in jumbo CDs - more of it is in repos and Eurodollars... surprise, surprise - the Fed is "fertilizing" M3... and corporate and fiduciary folk aren't quite as trusting now as shown by the institutional money market growth (this isn't consumer money market funds) and also aren't exactly cash poor after years of high profits.

                        Here's the chart of M3 components and its excessively busy as usual... but at least there are only 5 lines.

                        M3 components


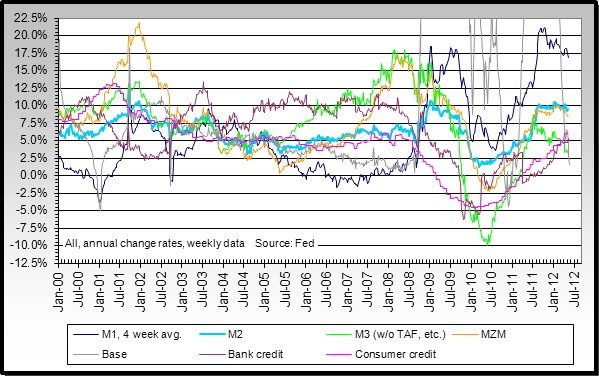
                        To add insult to busy chart injuring ;), here's a fuller picture of "money" during the period. Many have seen it before but I haven't explained it much.

                        Most "money supply" elements


                        The basic "take aways", when comparing 1999-2001 to now, are:
                        1. M1 dropped during both periods (went negative in late 2000 and is negative now)(M1 is roughly cash plus checking accounts)
                        2. M3 grew a lot during both periods
                        3. M2 is beginning to grow much like it did in early 2001
                        4. Bank credit has not yet shown a drop like what started in mid 2000 but there are strong indications from both my weekly chart and the "fun" with sub primes, etc. that it is imminent.

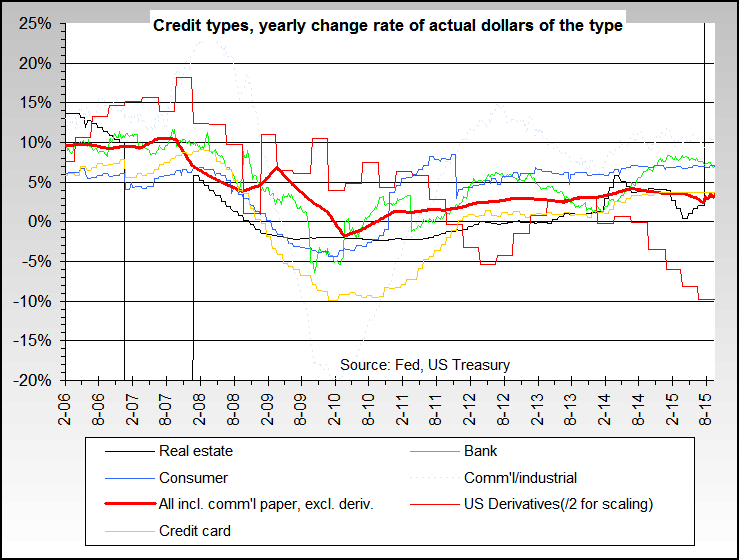
                        Overall yearly rate of growth in credit (the purple line below) has been dropping since late 2005, commercial / industrial (brown/burgundy line) is showing a large drop recently, consumer credit (blue line) is growing at a slower & slower rate - and for quite a while, and even my estimated real estate credit is showing signs of breaking down.

                        Credit types growth rates


                        Enough charts for you? ;)
                        Last edited by bart; February 21, 2007, 09:41 PM.
                        http://www.NowAndTheFuture.com

                        Comment


                        • #13
                          Re: True deflation: Is it a possibility worth worrying about?

                          Thanks, Bart. for all the work in putting together and explaining what you track.
                          Jim 69 y/o

                          "...Texans...the lowest form of white man there is." Robert Duvall, as Al Sieber, in "Geronimo." (see "Location" for examples.)

                          Dedicated to the idea that all people deserve a chance for a healthy productive life. B&M Gates Fdn.

                          Good judgement comes from experience; experience comes from bad judgement. Unknown.

                          Comment


                          • #14
                            Re: True deflation: Is it a possibility worth worrying about?

                            Originally posted by Jim Nickerson
                            Thanks, Bart. for all the work in putting together and explaining what you track.
                            You're welcome Jim.

                            The question is - did you get anything useful out of it with the additional explanations?

                            I'm curious what Finster's take will be too. He has a way of asking follow up questions that draw me out into simpler ways to state my views and make charts more useful & understandable.
                            Last edited by bart; February 22, 2007, 01:08 AM.
                            http://www.NowAndTheFuture.com

                            Comment

                            Working...
                            X