Announcement

Collapse
No announcement yet.

False bottom in payroll employment

Collapse
X
 
  • Filter
  • Time
  • Show
Clear All
new posts

  • False bottom in payroll employment

    False bottom in payroll employment

    This week saw more than the usual number of goofy interpretations of dubious government data. Today we are treated to bad but better than expected payroll employment numbers. President Bush expressed hope today that economic-stimulus rebates beginning to reach taxpayers this week will help the economy. "This economy is going to come on. I'm confident it will," Bush said while visiting a technology plant in a St. Louis suburb, reported the Associated Press. We are reminded of similarly optimistic pronouncements in previous post-bubble periods. "I am convinced that through these measures we have reestablished confidence," said Herbert Hoover, December 1929. "The spring of 1930 marks the end of a period of grave concern... American business is steadily coming back to a normal level of prosperity," reported Julius Barnes, head of Hoover's National Business Survey Conference, March 16, 1930. It's only natural to see the data in the best possible light, especially in an election year.

    Employers cut fewer jobs in April, jobless rate falls

    Employers cut fewer jobs in April, jobless rate falls to 5 percent

    May 2, 2008 (AP)

    WASHINGTON (AP) -- Employers cut far fewer jobs in April than in recent months and the unemployment rate dropped to 5 percent, a better-than-expected showing that nonetheless reveals strains in the nation's labor market.

    For the fourth month in a row, the economy lost jobs, the Labor Department reported Friday. But in April the losses totaled 20,000, an improvement from the 81,000 reductions in payrolls logged in March. Job losses for both February and March turned out to be a bit deeper than previously reported.

    The latest snapshot of the nationwide employment conditions -- while clearly still weak -- was better than many economists were anticipating. They were bracing for job cuts of 75,000 and for the unemployment rate to climb to 5.2 percent.

    AntiSpin: Bush's record for economic prognostications, equal to his talent for calling the ends of major combat operations, makes him too easy a target. CNN reported, "It's not good news, but it's not as bad as we thought it would be," said David Wyss, chief economist for Standard & Poor's. "It's consistant with the view it's going to be a mild recession, but an extended one, where you spend a lot of time bouncing around the bottom."

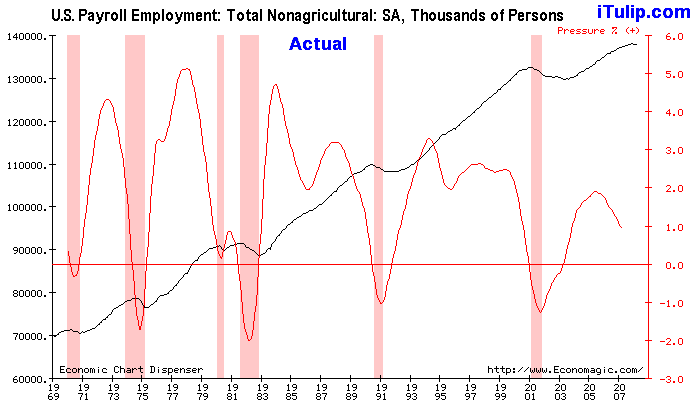
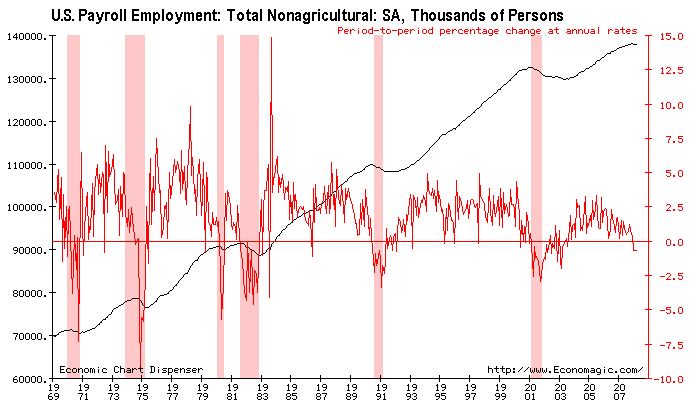
    We see nothing to indicate that anything like a "bottom" in the economy has been reached. Typically, payroll employment dives through a recession and does not "bump along the bottom" until well after the recession is over. Here are the payroll data going back to 1969 charted as of today. The black line is payroll employment while the red line shows year over year change.

    Job losses were concentrated in the usual areas: construction companies slashed 61,000 positions in April while manufacturers cut 46,000 and retailers cut 27,000.

    Job gains came, in a trend that started years ago, in leisure and hospitality as hotels swell with Europeans and Asians visiting the US to spend their euros, yen, and yuan on goods at fire sale prices and stay at US hotels for 50 cents on the euro. More jobs were created in education as discouraged workers duck recession by the tried and true method of going back to school. This improves the unemployment statistics which stop counting them as "unemployed" after they give up. Aging baby boomers created more demand for health care, swelling payrolls at health care facilities. Together, health care and education added 56,000 jobs.

    Gains again occurred again in the public sector, with government adding more than 9,000 jobs. Professional and business services companies added the most jobs. Not surprisingly, this category has the highest proportion of self-employed of all sectors. How many of your unemployed friends are "consulting"?

    Average weekly earnings were off by $1.45 as employers cut wages in response to higher costs, and employees, with a lot of debt and fewer jobs options, are in no position to fight the cuts.

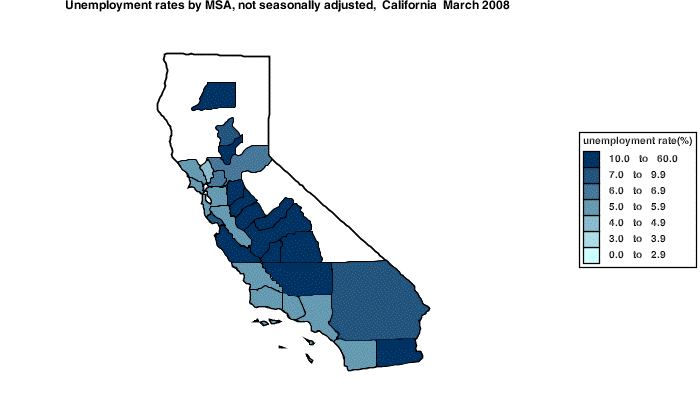
    The big job loss areas are those hardest hit by the housing and credit debacles, especially California. The map below shows in dark blue Metropolitan Statistical Areas that have official unemployment rates above 10%, per the Bureau of Labored Statistics.


    Our forecast projects payroll employment to decline by more than 90,000 in May.
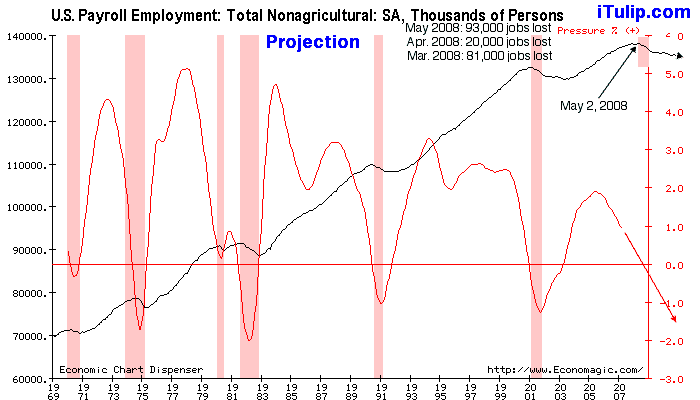


    Once the Q1 2006 GDP numbers are revised down to show negative real growth for the quarter, it will be more apparent that we are at the beginning of the down trend in payroll employment. Payroll employment will decline for the next several quarters while the year over year fall in employment will reach -1% before turning up.

    A mid-cycle bounce that you see slightly in 1976 and more pronounced in 1986 and 1996 might occur again in 2008 if similarly extreme government stimulus measures that were taken to create them are taken again and if they are effective without worsening inflation. In any case we should know by June whether a bounce is going to occur before payroll employment heads down into heavy negative territory.

    iTulip Select: The Investment Thesis for the Next Cycle™
    __________________________________________________

    To receive the iTulip Newsletter or iTulip Alerts, Join our FREE Email Mailing List


    Copyright © iTulip, Inc. 1998 - 2007 All Rights Reserved


    All information provided "as is" for informational purposes only, not intended for trading purposes or advice.
    Nothing appearing on this website should be considered a recommendation to buy or to sell any security or related financial instrument. iTulip, Inc. is not liable for any informational errors, incompleteness, or delays, or for any actions taken in reliance on information contained herein. Full Disclaimer
    Last edited by FRED; May 02, 2008, 04:39 PM.
    Ed.

  • #2
    Re: False bottom in payroll employment

    Nice report FRED. What does "pressure %" mean in the last graph?
    Jim 69 y/o

    "...Texans...the lowest form of white man there is." Robert Duvall, as Al Sieber, in "Geronimo." (see "Location" for examples.)

    Dedicated to the idea that all people deserve a chance for a healthy productive life. B&M Gates Fdn.

    Good judgement comes from experience; experience comes from bad judgement. Unknown.

    Comment


    • #3
      Re: False bottom in payroll employment

      Originally posted by Jim Nickerson View Post
      Nice report FRED. What does "pressure %" mean in the last graph?
      Both graphs show a red line that indicates year over year percent change. Pressure % simply means that the change is smoothed via a rolling average.

      Here's what it looks like if you don't smooth it. Same data but much harder to see what's going on.

      Ed.

      Comment


      • #4
        Re: False bottom in payroll employment

        Originally posted by FRED View Post
        Both graphs show a red line that indicates year over year percent change. Pressure % simply means that the change is smoothed via a rolling average.

        Here's what it looks like if you don't smooth it. Same data but much harder to see what's going on.


        Couldn't help but note that on both charts the %'age change bottomed during the recessions and employment was improving before the end of the official recession. Until the final two recessions ('91 & '01), which bottomed concurrent with the end of the recession.

        Not sure how relevant this is, other than investment trading perhaps, but is this because of the abbreviated nature of these two Greenspan-era recessions due to the massive stimulus applied to quickly end them? Or is there some other dynamic?

        Comment


        • #5
          Re: False bottom in payroll employment

          Originally posted by GRG55 View Post
          Couldn't help but note that on both charts the %'age change bottomed during the recessions and employment was improving before the end of the official recession. Until the final two recessions ('91 & '01), which bottomed concurrent with the end of the recession.

          Not sure how relevant this is, other than investment trading perhaps, but is this because of the abbreviated nature of these two Greenspan-era recessions due to the massive stimulus applied to quickly end them? Or is there some other dynamic?
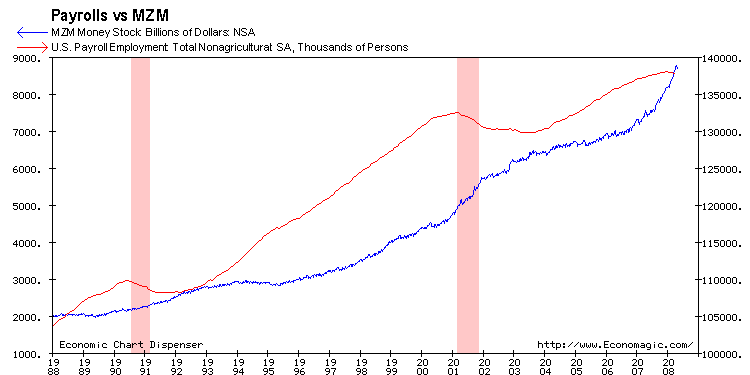
          The story is in the proper representation of the data. For example, here we chart a plot of payroll vs MZM without transformation.

          MZM is a proxy for the effectiveness of monetary and fiscal stimulus and payroll employment, with some lag, a proxy for the ability of the economy to convert that stimulus into jobs, plotting them against each other is useful.


          It shows MZM rising rapidly with no obious correlation to employment. To get what we want to know we need to transform the data to show the change in MZM and the change in payroll employment over the same period. So we plot MZM as a % change from the same period last year and payroll employment as a period-to-period change at annual rates. Here's what we get.


          It shows that stimulus that results in relatively small increases in MZM as occurred between mid 1990 and 1992 can, coming out of a recession, produce large increases in payroll employment as occurred 1991 to 1994. A second set of stimulus 1995 to 1996 produced a bounce from 1996 that held as MZM grew gradually until 2000. Not shown here are the Fed rate hikes that finally killed the asset bubble which brought down the economy.

          Then the heroic stimulus occurred 2001 to 2002 produced a massive spike in MZM and payroll employment started to grow again in 2002.

          MZM growth starting in 2007 "should" halt falling payroll employment by mid 2008. Maybe it will and we'll get a bounce. The MZM growth appears a bit tepid, certainly compared to the 2001 - 2002 jump, suggesting that more contraction will be needed, with inflation cooling, before the Fed is comfortable doing what it has to do to boost MZM.
          Ed.

          Comment


          • #6
            Re: False bottom in payroll employment

            of the 20k jobs lost, 267k were ADDED by the birth/death model, including the [assumed] addition of 45k jobs in construction and 8k jobs in financial services. color me skeptical.

            Comment


            • #7
              Re: False bottom in payroll employment

              More ground level data:

              In my hiring for my senior care caregivers - roughly 10% of applicants are refugees from the real estate market. Since I'm paying only somewhat over SF minimum wage ($9.36)...

              Comment


              • #8
                Re: False bottom in payroll employment

                So what you're trying to say is that the new jobs created are low end jobs?


                Originally posted by c1ue View Post
                More ground level data:

                In my hiring for my senior care caregivers - roughly 10% of applicants are refugees from the real estate market. Since I'm paying only somewhat over SF minimum wage ($9.36)...

                Comment


                • #9
                  Re: False bottom in payroll employment

                  Another factor or two applies to the "unexpected" drop in unemployment.

                  Per the NSA data at the BLS ( http://www.bls.gov/webapps/legacy/cpsatab12.htm ), unemployment normally drops in March and April.

                  Also, near the beginning of the last recession there was also an unexpected upward bounce for a month.
                  http://www.NowAndTheFuture.com

                  Comment


                  • #10
                    Re: False bottom in payroll employment

                    Originally posted by touchring
                    So what you're trying to say is that the new jobs created are low end jobs?
                    Well, I'm no sweat shop. I pay [limited] health and prescription drug benefits, and I pay more than minimum wage.

                    But my employees are all hourly.

                    So technically I have 17 employees, but only 3 are working just yet.

                    No matter how you look at it, a come-down from real estate of 2005.

                    Comment


                    • #11
                      Re: False bottom in payroll employment

                      Originally posted by c1ue View Post
                      More ground level data:

                      In my hiring for my senior care caregivers - roughly 10% of applicants are refugees from the real estate market. Since I'm paying only somewhat over SF minimum wage ($9.36)...
                      Originally posted by c1ue View Post
                      Well, I'm no sweat shop. I pay [limited] health and prescription drug benefits, and I pay more than minimum wage.

                      But my employees are all hourly.

                      So technically I have 17 employees, but only 3 are working just yet.

                      No matter how you look at it, a come-down from real estate of 2005.
                      Just to add to this, I read a local real estate article the other day that said the number of real estate agents in the Portland area dropped 23% in the past year. Our prices are only down ~5% so far... have to wonder how many more will be out of work or at least out of selling real estate in another year or two.

                      Comment

                      Working...
                      X